Skipping Meals and its Possible Effects on Lipid Profile of Purposively Selected Civil Servants in Aba, Abia State, Nigeria
Chukwuemeka, Obinna Godfrey1*, Nwankpa, Promise2, Ugwuezumba, P. C3, Etteh, C. C2, Ben-Udechukwu, Chioma4, and Okafor, P. N5
1 Michael Okpara University of Agriculture, Umudike, Abia State, Nigeria.
2 Department of Biochemistry, Imo State University, Imo State, Nigeria.
3 Department of Anatomy, Imo State University, Imo State, Nigeria.
4 Abia State Polytechnic, Aba, Abia State, Nigeria.
5 Professor of Biochemistry at Michael Okpara University of Agriculture, Umudike, Abia State, Nigeria.
*Corresponding Author
Chukwuemeka, Obinna Godfrey,
Michael Okpara University of Agriculture, Umudike,
Abia State, Nigeria.
E-mail: wayataya@yahoo.com
Recieved: August 01, 2015; Accepted: September 12, 2015; Published: September 16, 2015
Citation: Chukwuemeka, Obinna Godfrey, et al., (2015) Skipping Meals and its Possible Effects on Lipid Profile of Purposively Selected Civil Servants in Aba, Abia State, Nigeria. Int J Food Sci Nutr Diet. 04(4), 215- 220. doi: dx.doi.org/10.19070/2326-3350-1500039
Copyright: Chukwuemeka, Obinna Godfrey© 2015. This is an openaccess article distributed under the terms of the Creative Commons Attribution License, which permits unrestricted use, distribution and reproduction in any medium, provided the original author and source are credited.
Abstract
Skipping meals and its possible effects on lipid profile of purposively selected civil servants in Aba, Abia State, Nigeria was carried out by purposively selecting a total of 35 volunteer human adults. Questionnaires were used to assess the dietary habit while standard biochemical methods were employed for the lipid profile. The results from the anthropometric measurements showed that the mean weights (kg), heights (m), and body mass indices (BMI) (kg/m2) were 80.13 ± 13.41, 1.66 ± 0.18, and 26.98 ± 5.17 respectively for the males and 79.00 ± 16.14, 1.61 ± 0.12, and 26.89 ± 4.78 respectively for the females. The desirable BMI for both males and females are 18.5 to 24.9. Lipid profile result showed that the mean total cholesterol (TCH) was within desirable range of 188.13 ± 45.04 for the males and 196.42 ± 42.39 for the females and the mean high density lipoprotein cholesterol (HDL-C) was within low range of 44.87 ± 10.83 and 43.26±8.58 for the males and the females respectively. However, the mean low density lipoprotein cholesterol (LDL-C) was within the optimal range of 95.56 ± 38.86 and 114.37 ± 30.75 for males and females respectively. The mean triacylglycerols (TG) was within the borderline range of 173.63 ± 113.41 for the males and within normal range of 149.32 ± 100.28 for females. The total cholesterol/ high density lipoprotein ratio (TCHDL ratio) showed that the mean values for males and females were 4.64 ± 1.13 and 4.56 ± 2.02 respectively. The desirable range of TCHDL ratio for both males and females are 3.5 to 6.0. Correlation analysis showed positive correlations between BMI and LDL-C, Waist to hip ratio (WHR) and TAG, Waist circumference (WaistCir) and TAG. The implications of these findings as it relates nutrition and health are discussed.
2.Introduction
3.Justification
4.Objectives and Scope of Work
5.Materials and Methods
5.1.Sample
5.2.Life-style and nutritional/dietary assessments
5.3.Classifications
5.4.Statistical Analysis
6.Results and Discussion
6.1.Results
6.2.Discussion
7.Conclusion
8.Recommendations
9.References
Keywords
Cardiovascular Diseases (CVDs); Dyslipidemia; Serum Lipid Profile – High Density Lipoprotein (HDL); Low Density Lipoprotein (LDL); Total Cholesterol (TC); and Triacylglycerol (TAG); Anthropometrics – Body Mass Index (BMI); Waist to Hip Ratio (WHR); Waist Circumference; Hip Circumference.
Introduction
Cardiovascular disease is a big health problem and the leading cause of death in the UK and worldwide [11]. In the UK, over 1.6 million men and over one million women are affected by chronic heart diseases. Chronic heart diseases are responsible for more than 88,000 deaths in the UK each year (an average of 224 people each day or one death every 6 minutes) [11].
Non-communicable diseases (NCDs) such as heart diseases, stroke, diabetes, and cancer, now makeup two-thirds of all deaths globally, due to the ageing population and the spread of risk factors associated with globalization and urbanization [4]. By the year 2020, NCDs are expected to account for seven out of every ten deaths in the developing countries, compared with less than half today [24]. The World Health Report of WHO 1999 estimates that in 1998, 85 % of the Cardiovascular (CV) burden arose from the low and middle income countries. The CVD burden afflicts both men and women, with CV deaths accounting for 34 % of all deaths in women and 28 % in men in 1998 [17]. As the epidemics advances, the social gradient also reverses with the poor becoming the most vulnerable victims in both developed and developing countries [13].
The high burden of CVD in the developing countries is attributable to the increasing incidence of atherosclerotic diseases, perhaps due to urbanization and higher risk factor levels (such as obesity, diabetes, dyslipidemia, hypertension, etc), the relatively early age at which they manifest, the large sizes of the population, and the high proportion of individuals who are young adults or middle-aged in these countries [9]. Between 1990 and 2020,the increase in Ischemic Heart Disease (IHD) mortality (120 % in women and 137 % in men) in the developing countries is expected to be much greater than among developed countries (29 % and 48 % , respectively) [9]. These projections are based largely on the expected changes in the demographics of the population and does not account for potential increases in risk factor indices [15, 2]. However, with urbanization and changing lifestyles, the number of people with diabetes, obesity, dyslipidemia, and high blood pressure may increase, suggesting that the increases in CVD based purely on demographic shifts are likely underestimates.
The control of risk factors such as use of tobacco, sedentary lifestyle, unhealthy diet and excessive use of alcohol become more critical. Therefore, monitoring and management of lipid profile and serum lipid pro-atherogenic indices of the subjects may be tools in the prevention of CVD morbidity and mortality among them.
Justification
Abnormal amount of blood lipid (dyslipidemia) has been implicated as a major risk factor for CVD and an individual risk of CVDs can be predicted from serum lipid pro-atherogenic indices. Increases in CVDs morbidity and mortality may be due to changes in dietary pattern and have resulted in double burden ofdisease in both middle and upper class strata in developing nations like Nigeria.
Objectives and Scope of Work
The primary objective of this work is aimed at assessing the lipid profile of the subjects and the measurement of their serum lipid pro-atherogenic risk factors.
The following will be taken into consideration:
- Assessment of lipid profile of the subjects
- Assessment of their nutritional status
- Assessment of subjects’ dietary intake
Materials and Methods
This study was conducted with questionnaire which included questions on dietary habits. Nutritional status was assessed using anthropometry (weight, height, hip and waist circumferences) [21]. Dietary intake was assessed with a 24-hours dietary recall. Serum lipid pro-atherogenic measurement of the subjects was monitored by measuring their serum total cholesterol (TC), serum high density lipoprotein-cholesterol (HDL-C), serum low density lipoprotein-cholesterol (LDL-C) and serum triacylglycerols (TG). Their total cholesterol/high density lipoprotein cholesterol ratio (TC/HDL-C ratio) was calculated. Serum cholesterols were measured using cholesterol kits obtained from RANDOX laboratories Ltd, United Kingdom.
A total of 35 volunteers were purposively selected from the above mentioned parastatals. The volunteers were all staff of the above mentioned parastatals. Informed consents were obtained from the subjects and requirements for the study were fully explained to them. Inclusion criteria included public servants that were asymptomatic, not taking chronic medications and were willing to participate in the study. The anthropometry aspect of the data collection was taken in duplicates according to WHO standard protocol [22].
Fasting blood samples were collected intravenously from volunteers and the biochemical assays for serum lipid pro-atherogenicindices were carried out using standard cholesterol kits (RANDOX laboratories Ltd., United Kingdom).
Life-style assessment of the subjects was done using daily activity questionnaire which included leisure time physical activity (for example, dancing, swimming, gardening), transportation (e.g. driving, walking, cycling), occupational (i.e. work), household chores, play, games, sports or planned exercise, in the context of daily exercise. The number of times the individuals indulge in these activities in a week gives an idea of how sedentary or not an individual’s lifestyle is, according to World Health Organization recommended levels of physical activity for adults aged 18 - 64 years [23].
Nutritional status was assessed with anthropometric measurements such as weight, height, hip and waist circumferences, BMI, and WHR [21]. Weight was measured with Hanson H61 mechanical bathroom scale manufactured by Hanson, USA. Respondents were asked to remove their shoes and wrist watches and were made to stand on the scale and reading taken to the nearest 0.1kg. Height was measured with heightometer and respondents were made to stand erect with their shoes taken off and the measurement was done to the nearest 0.1 cm. Waist circumference was measured with a tape. The subjects stood with his or her weight evenly distributed on both feet which were about 25 – 30cm apart. The measurement was taken midway between the upper hip bone and the uppermost border of the right iliac crest. The tape was placed around the abdomen at the level of this midway point and a reading taken when the tape was snug but does not compress the skin and underlying soft tissues. The circumference was measured to the nearest 0.1cm. Three measurements were taken and the mean calculated. Hip circumference was measured when the subject stood erect with arms at the sides and feet together. Measurement is only taken when the maximum extension of the buttocks was seen and this can be seen by standing at the side of the subject. The tape was placed around the buttocks in a horizontal plane. The tape was sung against the skin but does not compress the soft tissues. The measurement was recorded to the nearest 0.1cm with the subject wearing light dressing around the hip. Dietary intake was assessed with a 24-hour dietary recall, and food record. BMI was generated from the ratio of weight (kg) to height (m2) of the subjects.
Waist to hip ratio (WHR) was also determined. All anthropometric measurements were determined using the methods described by World Health Organization (1995).
Total cholesterol (TC) (mg/dl)
Desirable < 200
Borderline high 200 - 239
High ≥ 240
High density lipoprotein (HDL) (mg/dl)
Desirable ≥ 60
Normal 40 - 59
Low < 40
Low density lipoprotein (LDL) (mg/dl)
Optimal < 100
Near Optimal 100 - 129
Borderline high 130 - 159
High 160 - 189
Very high ≥ 190
Triacylglycerol (TG) (mg/dl)
Normal < 150
Borderline high 150 - 199
High 200 - 499
TC/HDL-C ratio (mg/dl)
Male
Normal range 4.0 - 6.0
At risk > 6.0
Female
Normal range 3.7 - 5.7
At risk > 5.7
Body mass index (BMI) (kg/m2)
Underweight < 18.49
Normal weight 18.5 - 24.99
Overweight 25 - 29.99
Obese 30 - 35
Severely obese > 35
Waist to hip ratio (WHR)
Males
Safe < 0.95
At risk > 0.95
Females
Safe < 0.80
At risk > 0.80
Source: Ene-Obong, et al., (2001); NCEP (2001); WHO (2001); Theonenet al., (2002); Birtcher and Ballantyne (2004).
Data collected were analyzed using Statistical Package for Social Sciences (SPSS) version 16. Variables were assessed with descriptive statistics such as frequencies, percentages, and means. Student’s T-test was used to determine differences between male and female adults. Pearson’s correlation coefficient was employed in the determination of the association between numerical variables, whereas Chi square (χ2) was employed for categorical variables. P < 0.05 was regarded as statistically significant.
Results and Discussion
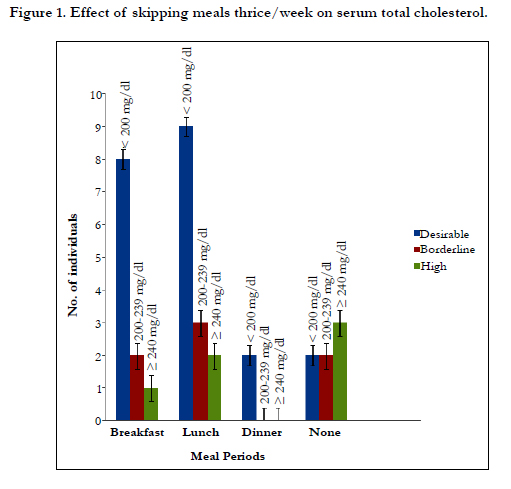
Figure 1. Effect of skipping meals thrice/week on serum total cholesterol.

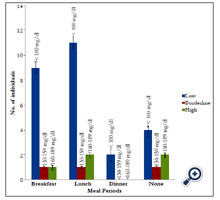
Figure 2. Effect of skipping meals thrice/week on serum low density lipoprotein.

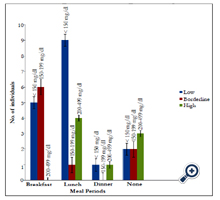
Figure 3. Effect of skipping meals thrice/week on serum triacylglycerol.
Results obtained from this study revealed that an association exists between lipid profile and nutritional/dietary habit. Table 1 represents the mean anthropometric values of the subjects. The mean weight, height and BMI of the males were 80.13 ± 13.41, 1.66 ± 0.18 and 26.98 ± 5.17 respectively while that of females were 79.00 ± 16.14, 1.61 ± 0.12 and 26.89 ± 4.78 respectively. However, males had greater mean waist circumference, 78.89 ± 31.28 than females, 69.14 ± 34.18 whereas females had greater mean hip circumference, 96.45 ± 34.83 than males, 83.23 ± 0.08. There was no significant difference (P > 0.05) in all the anthropometric parameters between both sexes except for WHR where the females had significantly higher value than the males (P < 0.05).
Table 2 shows the mean serum lipid profile of the male and female adults. The mean TC, HDL-C, and Triacylglycerol (TAG) were within the reference range. The females however, had mean LDL-C values of 114.37 ± 30.75 which is slightly above the reference range. Studies have shown that high LDL is strongly associated with a higher risk of cardiovascular diseases, while HDL-C is more protective. The values obtained for LDL-C was similar to that obtained among a group of adults in Delta state (113.8 mg/ dl) [7]. The TC/HDL-C ratio revealed that the mean value for males and females were 4.64 ± 1.13 and 4.56 ± 2.02 respectively. In both cases, they were within the normal range. All lipid fractions were statistically similar in males and females (P > 0.05). TCHDL ratio is a useful guideline for advising individuals about their risk of cardiovascular diseases [8]. The males and females had mean values of 4.8 and 4.5 respectively. This indicates that both sexes may only be at slight risk of cardiovascular diseases. The mean values correspond to results of Ighosotu and Tonukari (2010) which reported TCHDL-C ratio of 4.33 among a group of Delta state subjects.
According to Wikipedia, (2013), in developed countries, most dyslipidaemias are hyperlipidaemias (elevation of lipids in the blood) and this is often as a result of diet and lifestyle. Other studies showed that elevated cholesterol or fat in blood is a prominent risk factor for CVD. Hooper et al. (2011) showed that reducing saturated fat in diets reduced the risk of having a cardiovascular event by 14 %. From the statistical data obtained, serum total cholesterol (TC) was significant with serum TAG (r = 0.354; P = 0.037), serum LDL (r = 0.842; P = 0.00) and serum Total Cholesterol/ HDL ratio (TC/HDL ratio) (r = 0.541; P = 0.001). However, the correlation coefficients of serum LDL and TCHDL ratio seem stronger than that of serum TAG. HDL-C has been identified in many research findings as an anti-atherosclerosis factor hence; it is called the “good cholesterol”. A research finding has shown that there is a relationship between LDL and HDL and that for a given level of LDL, the risk of heart disease increase 10-fold as the HDL varied from high to low and on the converse, however, for a fixed level of HDL, the risk increased 3-fold as LDL varied from low to high [16, 14].
Obesity and overweight are some of the CVD risk factors that could easily be detected from anthropometric measurements [10]. According to the National Institutes of Health, obesity and overweight together are the second leading cause of preventable death in the United States, close behind tobacco use [12]. The Pearson’s correlation analysis obtained in this study showed that Body Mass Index (BMI) was statistically significant with weight (r = 0.812; P = 0.000) and also showed that waist per hip ratio (WHR) was statistically significant with waist circumference (WaistCir) (r = 0.446; P = 0.007).
The effect of various diets on total cholesterol (TC), low density lipoprotein-cholesterol (LDL-C), high density lipoproteincholesterol (HDL-C), and Triglycerides (TRG) or better called, Triacylglycerols (TAG) was investigated and the staple foods in Aba are usually heavy calorie foods such as garri, fu-fu, rice, yam and beans which are usually prepared or eaten with large quantities of saturated oils like palm oil and groundnut oil. Therefore, skipping such meals either in breakfast, lunch or dinner could often have a positive impact or effect in total lipid profile of an individual which were also observed in this study, though skipping meals would not conclusively be causative in this study due to other underlying factors like quantity of food consumed at a given meal period, burning of fat through physical activity, etc., which may not be easily detected. However, Hooper et al. (2011), revealed that reducing saturated fat in diets reduced the risk of having a cardiovascular event by 14 %. Figure 1, shows that subjects who skip breakfast or lunch thrice a week has a desirable serum total cholesterol level than those who never skip meals. Figure 2, shows the effect of skipping meals on LDL. Subjects who skipped breakfast and/or lunch at least thrice a week had significant low serum LDL level. Therefore, skipping meals could also protect against atherosclerotic plague of which LDL oxidation is a strong initiator of atherosclerosis. In Figure 3, skipping lunch had a more desirable serum TAG level. From correlation analysis, weight was significant with BMI (r = 0.812; P = 0.000) and BMI was significant with LDL (r = 0.439; P = 0.008). Despite the fact that the relationship between BMI and LDL-C is relatively weak, this association could be as a result of the staple foods consumed in Aba which are high in calorie and usually prepared with palm oil, saturated oil (containing palmitate, 44 % saturated and stearate, 5 % saturated) which is often used in making soups, stews and sauces.

Table 1. Socio-demographic characteristics of the adults.
Table 2. Mean values of anthropometric measurements of the adults.
Table 3. Mean serum lipid profile of the male and female adults.
Conclusion
In conclusion, the assessment of the lipid profile and serum lipid pro-atherogenic indices and the anthropometric values obtained, proved important tools in the investigation of risks of CVDs among the subjects.
It seemed that skipping meals either advertently or inadvertently had a positive effect in reducing lipid profile and the study population however, had favorable lipid profile with the exception of LDL-C. However, there is the likelihood that the favorable lipid profile may not be sustained for long due to lifestyle changes and nutritional/dietary habit. There is thus, a need for continuous education on healthy lifestyles and good dietary practices in order to sustain the protection.
However, the relationship between diet and disease must be reviewed in the light of the complexities that underlie the data and for this reason; data obtained in this work do not conclusively prove a cause-and-effect relationship but provides a reasonable basis for further research
Recommendations
Sensitization programs are necessary in order to reveal the dangers of unhealthy dietary habits and ways to prevent them.
There is a relationship existing between diet and disease but the extent or magnitude of this relationship is largely not known due to limitations with the design of the study. Hence, further critical studies could be beneficial to understanding the extent to which diet and disease are associated.
This research was done through purposive selection of the subjects in other to qualitatively, critically, and carefully carryout the esearch hence, the small number of subjects involved. However, a larger number of subjects will be needed if results are to represent the entire population of all civil servants in Aba, Abia State, Nigeria.
Aba is a fast growing city, population-wise and in terms of modernization. The mechanisms by which these growth affect the lifestyle, nutrition and dietary habits as well as health in general, of the subjects is still largely not known. Further studies however, could be of help.
References
- Birtcher KK, Ballantyne CM (2004) Measurement of cholesterol: A patient perspective. Circulation 110(11): 296-297.
- Chockalingam A, Balaguer-Vinto I (1999) Impending Global Pandemic of Cardiovascular Diseases: Challenges and Opportunities for the Prevention and Control of Cardiovascular Diseases in Developing Countries and Economies in Transition. World Heart Federation. Barcelona, Spain.
- Ene-Obong HN, Enugu GI, Uwaegbute AC (2001) Determinants of Health and nutritional status of rural Nigerian women. J Health Popul Nutr 19(4): 320-330.
- Finnish Medical Society (2013) Global burden of disease. Duodecimin.
- Fujishiro K, Xu J, Gong F (2010) What does “Occupation” represent as an indicator of socio-economic status?: exploring occupational prestige and health. Soc Sci Med 71(12): 2100-2107.
- Hooper L, Summerbell CD, Thompson R, Sills D, Roberts FG, et al. (2011) “Reduced or modified dietary fat for preventing cardiovascular disease”. The Cochrane Library 3(7): 21-37.www.duodecim.fi/verkkokurssit/
- Ighosotu S, Tonukari NJ (2010) The influence of dietary intake on the serum lipid profile, body mass index and risk of cardiovascular diseases in adults on the Niger Delta region. Int J Nutr Metab 2(3): 40-44.
- Kocaoghe B, Moschonis G, Dimitriou M, Kolotouron M, Keskin Y, et al. (2005) Parental education level and cardiovascular disease risk factors in school-children in large urban areas of turkey: Directions for public health policy. BMC public Health 5: 13-22.
- Murray CJ, Lopez AD (1996) The global burden of disease and injury series, volume 1: a comprehensive assessment of mortality and disability from diseases, injuries, and risk factors in 1990 and projected to 2020. Harvard School of Public Health, Boston.
- National Cholesterol Education Program (NCEP) (2001) Expert Panel on Detection, Evaluation, and Treatment of High Blood Cholesterol in Adults (Adult Treatment Panel III). J Amer Med Assoc 285(19): 2486-2497.
- National Health Service (NHS) Choices (2013).www.nhs.uk/../Introduction.aspx
- National Institutes of Health, National Heart, Lung, and Blood Institute (1998) Clinical guidelines on the identification, evaluation, and treatment of overweight and obesity in adults. Executive summary.
- Popkin BM (1998) The nutrition transition and its health implication in lower-income countries. Public Health Nutr 1(1): 5-21.
- Rahilly-Tierney CR, Spiro A 3rd, Vokonas P, Gaziano JM (2011) Relation between high-density lipoprotein cholesterol and survival to age 85 years in men (from the VA normative aging study). Am J Cardiol 107(8): 1173- 1177.
- Reddy KS, Yusuf S (1998) Emerging epidemic of cardiovascular disease in developing countries. Circulation 97(6): 596-601.
- Rubins HB, Robins SJ, Collins D, Nelson DB, Elam MB, et al. (2002) Diabetes, plasma insulin, and cardiovascular disease: Subgroup analysis from the Department of Veterans Affairs high-density lipoprotein intervention trial (VA-HIT). Arch Intern Med 162(22): 2597-2604.
- The World Health Report (1999) Making a Difference. World Health Organization, Geneva. www.who.int/whr/1999/en/whr99_en.pdf
- Theonen E, Wright JG, Chaudhari A, Doria J, Kennedy JD, et al. (2002) Obesity: Facts, Figures, Guidelines Bureau for Public Health, West Virginia.163.
- Wikipedia (2013) Dyslipidemia. en.wikipedia.org/wiki/dyslipidemia
- World Health Organization (WHO) (2011) Non communicable Diseases Country Profile (Nigeria). www.who.int/nmh/countries/nga_en.pdf
- World Health Organization (1988) The use of anthropometry to assess nutritional status. World Health Statistics 41(2): 48-58.
- World Health Organization (1995) Physical status: the use and interpretation of anthropometry. WHO Technical Report 854, Geneva.
- World Health Organization (2010) Global recommendations on physical activity and health for adults between 18-64 years. whqlibdoc.who.int/publications/2010
- World Health Organization (2012) Health Transition. www.who.int/../en/
- Yusuf S, Hawken S, Ounpuu S, Dans T, Avezum A, et al. (2004) Effect of potentially modifiable risk factors associated with Myocardial Infarction in52 countries (the Interheart Study): case-control study. Lancet 364(9438): 937-952.