Development of Method for Rapid Quantification of Glucose, Fructose and Sucrose in Mango Juice by Chemometric Techniques in De-noised FTIR Spectroscopic Data
Uddin MN1*, Majumder AK2, Ahamed S1, Saha BK3, Motalab M3
1 BCSIR laboratories, Dhaka, Bangladesh Council of Scientific and Industrial Research (BCSIR), Dhaka, Bangladesh.
2 Jahangirnagar University, Dhaka, Bangladesh.
3 Institute of Food Science and Technology (IFST), Bangladesh.
*Corresponding Author
Nashir Uddin,
BCSIR laboratories, Dhaka,
Bangladesh Council of Scientific and Industrial Research (BCSIR), Dhaka-1205, Bangladesh.
Tel: 880-01912068516
Fax: 88 02 58613022
E-mail: nashir@bcsir.gov.bd
Received: November 30, 2016; Accepted: March 13, 2017; Published: March 16, 2017
Citation: Uddin MN, Majumder AK, Ahamed S, Saha BK, Motalab M (2017) Development of Method for Rapid Quantification of Glucose, Fructose and Sucrose in Mango Juice by Chemometric Techniques in De-noised FTIR Spectroscopic Data. Int J Food Sci Nutr Diet. 6(1), 338-344. doi: http://dx.doi.org/10.19070/2326-3350-1700060
Copyright: Uddin MN© 2017. This is an open-access article distributed under the terms of the Creative Commons Attribution License, which permits unrestricted use, distribution and reproduction in any medium, provided the original author and source are credited.
Abstract
The present study is aimed to develop a chemometrics assisted method for predicting simple sugars (glucose, fructose and sucrose) in mango juice by using the best calibration technique among Artificial Neural Network (ANN), Principal Component Regression (PCR) and Partial Least Squares Regression (PLSR) in de-noised data from Fourier Transformed Infrared (FTIR) spectrophotometer. Sixty four mixture solutions of eight different concentrations of sugars and fifteen commercial mango juices have been run in FTIR, and spectral data are used for development, validation and test of models. Standard Normal Variate (SNV), Savitzky-Golay (S-G) filtering and Multiplicative Scatter Correction (MSC) have been used for de-noising spectral data before calibration. Among the alternatives, the best prediction performance is noticed by ANN in spectral range 1500-952 cm-1 and S-G filtering (R2≈0.99). Prediction of simple sugars concentration by ANN with FTIR spectroscopic data after de-noised with S-G filtering is a cost-effective and easy method for quantification of sugars in commercial mango juice.
2.Introduction
3.Materials and Methods
3.1 Collection of Commercial Mango Juice
3.2 Preparation of Standard Mixture Solutions
3.3 FTIR Measurements
3.4 Preprocessing of Spectral Data
3.5 Calibration Methods
3.6 Calibration and Validation Datasets
4.Results and Discussion
4.1 De-Noising of Spectral Data
4.2 Prediction of Sugars Percentage by ANN with Raw and De-Noised Data
4.3 Prediction of Sugars by PCR and PLSR with De-Noised Data
5.Conclusions
6.References
Keywords
Prediction; Simple Sugars; FTIR; Spectral Data; Preprocessing; Chemometric Techniques.
Introduction
Bangladesh is one of the top ten mango growing countries in the world [1]. Mango juices are getting popularity among people of all ages. So, a number of mango juice manufacturing industries have been established. Some of the industries are exporting their product abroad. Now the quality of mango juices is a great concern both for producers and consumers. Over use of artificial sugars is one of the depressing factors and causes serious threat to public health [2]. Therefore, simple, easy and cost effective testing methods are necessary to ensure quality of mango juice for manufactures, consumers and food quality regulating authorities. Different chromatographic methods like High Performance Liquid Chromatography (HPLC), Gas Chromatography (GC), etc are used to determine concentration of sugars in foods especially fruit juice [3, 4] and honey [5]. All these methods need tiresome and complex pretreatment of samples. Moreover, standard chemicals are used in these methods, and they require high cost for storage and disposal. On the contrary, in chemometric techniques, mathematical models are used with spectral data from instruments against known concentration of analyte where no standard chemicals are used. So, multivariate calibration methods are cheaper, faster and do not generate chemical waste [6].
Multivariate analysis techniques in Fourier Transformed Infrared (FTIR) spectroscopic data were applied to develop chemometric method for quantification of sugars in mango juice [7]. Here glucose, fructose and sucrose were estimated as a function of ripening from the model. In another study, authentication of sweeteners of mango juice using FTIR was studied by estimating Added Sugar Content (ASC), Total Sugar Solution (TSS) and Real Juice Content (RJC) [8].
Spectral data contain instrumental noises which to be reduced before modeling. Several de-noising techniques are used by scientists. Standard Normal Variate (SNV), Savitzky-Golay (S-G) filtering and Multiplicative Scatter Correction (MSC) are popularly used in this purpose. But their performance varies greatly according to the nature of the data. Similarly, Artificial Neural Network (ANN), Principal Component Regression (PCR) and Partial Least Squares Regression (PLSR) are most frequent chemometric techniques for calibration, and their prediction efficiencies are to be assessed to peek the best one for the spectral data used to choose the best one among the alternatives for quantification of glucose, fructose and sucrose in mango juice.
Objective of the study is to develop a rapid and inexpensive method for quantification of glucose, fructose and sucrose in commercial mango juice by using FTIR spectroscopy and comparatively better performing de-noising and calibration techniques.
Fifteen commercially available mango juices of different locally manufacturing companies were collected from different outlets. At first, concentration of glucose, fructose and sucrose in commercial juices were measured at laboratory by standard AOAC method [9].
Standard mixture solutions of three sugars available in mango juice, i.e., glucose, fructose and sucrose, were prepared. Eight different concentrations of glucose (0.5, 1.0, 1.5, 2.0, 2.5, 3, 5, 10 percent), fructose (0.5, 1.0, 1.5, 2.0, 2.5, 3, 5, 10 percent) and sucrose (7.0, 7.5, 8.0, 8.5, 9.0, 9.5, 10.0, 15.0 percent) were used to prepare artificial mixture solutions. These concentrations were considered here because the concentration of sugars in commercial juices varies among these ranges. Here “Orthogonal Experimental Design” was used to statistically maximize the information in the outputs. Thus, in total 64 mixtures were prepared with different concentrations of glucose, fructose and sucrose. According to the combination of concentrations from experimental design, the sugars were dissolved into de-ionized water to make solutions. Both mixture solutions and commercial juices were used in FTIR to get spectral data.
Fourier Transformed Infrared (FTIR) spectrometer (Shimadzu, Model: IRAffinity1) connected to software of IR Solution Operating system (Version 1.40) was used to obtain FTIR spectra of samples. The samples were placed in contact with Attenuated Total Reflectance (ATR) element at controlled ambient temperature. FTIR spectra were collected in frequency 4000-650 cm-1 by coadding 30 scans and at resolution of 4 cm-1. Before every scan, a new reference air background spectrum was taken. There spectra were recorded as absorbance values at each data point in triplicate. The ATR plate was carefully cleaned in situ by wiping it with acetone, and dried with soft tissue before filling in with next sample.
The spectral data acquired from instrument contain spectra background information and noises which are interfered desired relevant quality attributes information. Interfering spectral parameters, such as light scattering, path length variations and random noise resulted from variable physical sample properties or instrumental effects need to be eliminated or reduced in order to obtain reliable, accurate and stable calibration models. Thus, it is very necessary to pre-process spectral data prior to modeling. Preprocessing methods can include averaging over spectra, which is used to reduce the number of wavelengths or to smooth the spectrum [9]. FTIR spectral data were preprocessed by de-noising them, and their efficiencies were assessed and compared here. For this three de-noising techniques, (1) Standard Normal Variate (SNV), (2) Multiplicative Scatter Correction (MSC) [10], and (3) Savitzky–Golay (S-G) filtering were used. Two de-noise efficiency measures, such as, Signal to Noise Ratio (SNR) and Root Mean Squared Error (RMSE) were used here.
All parts of a spectrum are not equally important to predict the considered variable. So it is necessary to find out which portion of the spectrum is contributing more to predict efficiently. Four different spectral range and full range were considered for analysis as spectral peaks and variation of absorbance could be observed in these regions of the spectra. The selected ranges are 3700-648 (full range), 3700-2880, 1800-1500 and 1500-952 wave number (cm-1), where variations are noticed after plotting the spectral data against wave numbers.
Artificial Neural Network (ANN): An ANN is a data processing system based on the structure of the biological neural simulation by learning from the data generated experimentally or using validated models [11]. Application of ANN is a technique for data and knowledge processing, characterized by its analogy with a biological neuron [12], and can deal with nonlinear relationships between variables [13] and [14]. Use of ANN in food authentication studies has been gaining popularity among food scientists, food processing industries and food quality regulating authorities [15, 16].
A network consists of a sequence of layers with connections between successive layers. Data to the network is presented at input layer and the response of the network to the given data is produced in the output layer. There may be several layers between these two principal layers, which are called hidden layers. Finally, the use of a neural network approach to build a predictive model for a complex system does not require a statistician and domain expert to screen through every possible combination of variables. Thus, the neural network approach can dramatically reduce the time required to build a model.
In practical, Levenberg-Marquardt back-propagation neural network was used in the study. Number of hidden layers was 10 and the sigmoid activation function was used in each training. Training automatically stopped when generalization stops improving, as indicated by an increase in the root mean square error (RMSE) of the validation samples.
Principal Component Regression (PCR) and Partial Least Square Regression (PLSR): Absorbance of light by certain component against wave number is the main consideration for FTIR spectral data. In each spectrum there are huge number of absorbance values for each wave point. Each wave number or data point is considered as spectroscopic variable. These variables are huge in number and are mutually correlated. In this situation we cannot use Ordinary Least Square (OLS) regression to singularity problem. So, PCR and PLSR are playing a key role in spectroscopic data analysis. These two techniques extract a set of orthogonal factors called 'latent variables' from the predictors which have best predictive power. Here first 10 and 20 principal components were used respectively for prediction.
Known concentrations of simple sugars and spectral data of 52 artificial mixture solutions were used to develop or train the models, 12 solutions for validate them. Finally, those of 15 commercial mango juices were used to test the efficiencies of developed models for predicting concentrations of glucose, fructose and sucrose in real samples of mango juice.
All the computer programs used to generate the results were written in MATLAB (version 8.1.0.604, The Math Works Inc., Natick, USA).
Results and Discussion
Spectral plot of mixture solutions of sugars and real mango juices are presented in Figure 1. Each spectra contains instrumental noise which have been removed first from the spectral data.
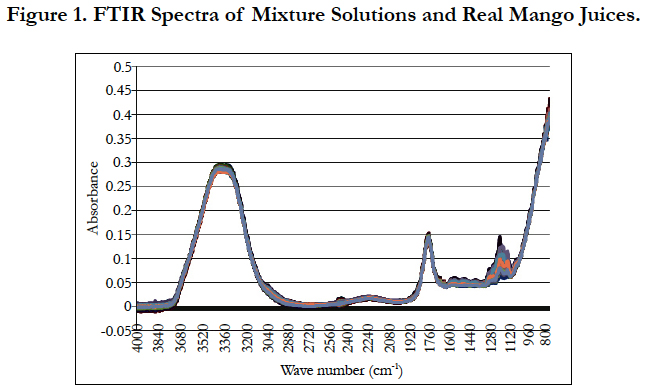
Figure 1. Chemical Structures of Major CGAs Present in Coffee.
De-noising performance of SNV, MSC and S-G filtering were assessed in different wave ranges, in different sets of data and in different calibration models, and the results are presented in Tables 1 to 6.
Prediction of glucose percentage by ANN with de-noised data: Prediction of glucose by Artificial Neural Network was used with raw data and de-noised data with three methods, SNV, S-G filtering and MSC. It is evident that SNV treatment can not improve the perdition performance noticeably. Moreover, in some cases it is worse than that of raw data. Prediction is better with S-G filtering and MSC than that of raw data. Among these three de-noising techniques and raw data, S-G filtering shows the best results in terms of both RMSEP and R2 in all spectral ranges and with all sets of data (training, validation and test) (Table 1).
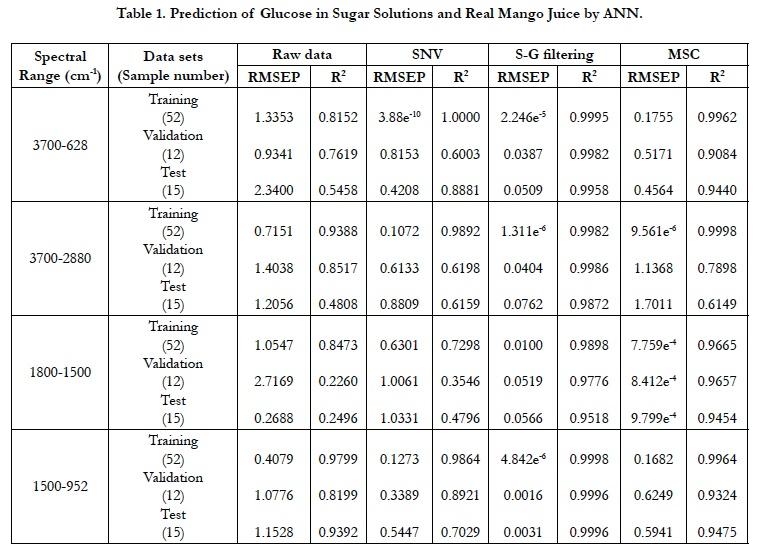

Table 1. Prediction of Glucose in Sugar Solutions and Real Mango Juice by ANN.
Full spectral data and three different ranges of spectra have separately been calibrated with ANN for prediction of glucose. Calculated RMSEP and R2 values show that prediction is best in the spectral range 1500-952 cm-1 among the selected ranges, and it is followed by full range, 3700-628 cm-1. Spectral range 3700-2880 cm-1 shows the next informative range and least one is 1800-1500 cm-1. That means, FTIR range 1500-952 cm-1 is the most informative region for prediction of glucose in mango juice by ANN. It is also noticed that among the de-noising techniques S-G filtering is the best in training, validation and test data sets (Table 1).
Prediction of fructose percentage by ANN with de-noised data: Prediction performance of fructose by ANN with raw and de-noised data in selected spectral ranges are presented in Table 2. It is clear from the table that prediction is better with S-G filtering and MSC techniques of spectral data de-noising than raw data, but with SNV treatment, the performance is worse. S-G filtering shows the best results in terms of both RMSEP and R2. In case of fructose prediction, FTIR range 1500-950 cm-1 shows consistently maximum R2 values for training, validation and test data.
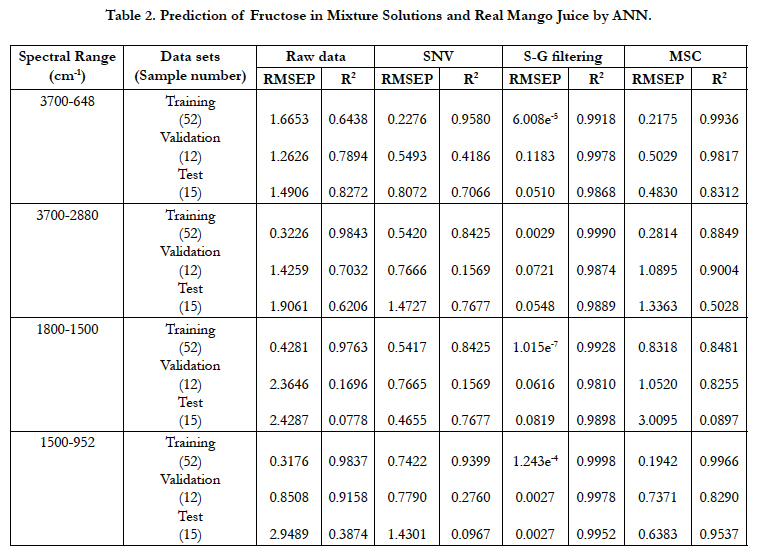
Table 2. Prediction of Fructose in Mixture Solutions and Real Mango Juice by ANN.
Prediction of Sucrose Percentage by ANN with De-Noised data: It is evident from Table 3 that prediction performance of sucrose by ANN is better after de-noised spectral data by S-G filtering and MSC than that of raw data, but with SNV treatment, the performance becomes worse. Among these three de-noised data and raw data S-G filtering shows the best results. Hence, in order to predict sucrose concentration in mango juice, ANN is an appropriate method but to get better result spectral data should be de-noised with S-G filtering.
Like glucose and fructose, 1500-952 cm-1 is the most informative among all selected spectral ranges for prediction of sucrose (Table 3).
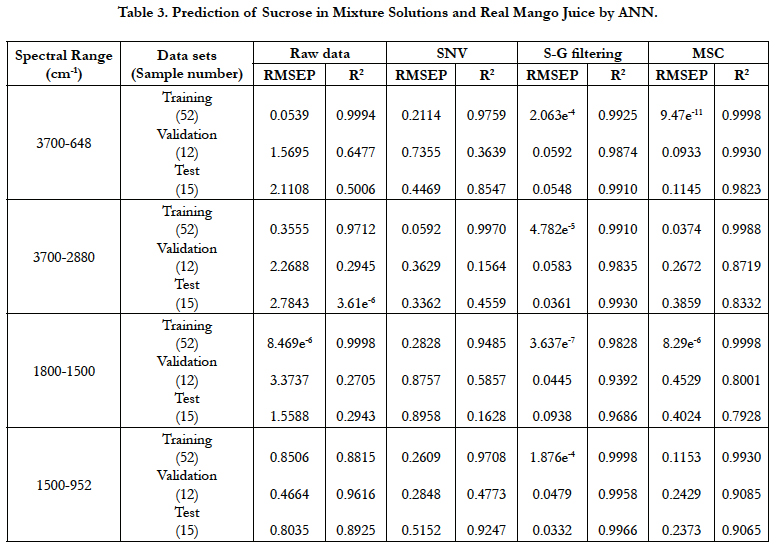
Table 3. Prediction of Sucrose in Mixture Solutions and Real Mango Juice by ANN.
To sum up, for prediction of glucose, fructose and sucrose by ANN, FTIR wave number range 1500-952 cm-1 shows constantly maximum R2 values and minimum RMSEP values. Further, S-G filtering shows the best de-noising performance in all spectral ranges and with all sets of data (R2≈0.99).
Principal Component Regression (PCR) and Partial Least Squares Regression (PLSR) are calibrated for quantification of glucose, fructose and sucrose with spectral values of artificial mixture solutions, and are validated with those of real mango juices in the study. Here calibrations are done with 10 and 20 latent variables, Principal Components (PCs). A comparative picture of predictive performance of these two statistical methods i.e., PCR and PLSR in terms of R2 and RMSEP are shown in the Tables 4-6.
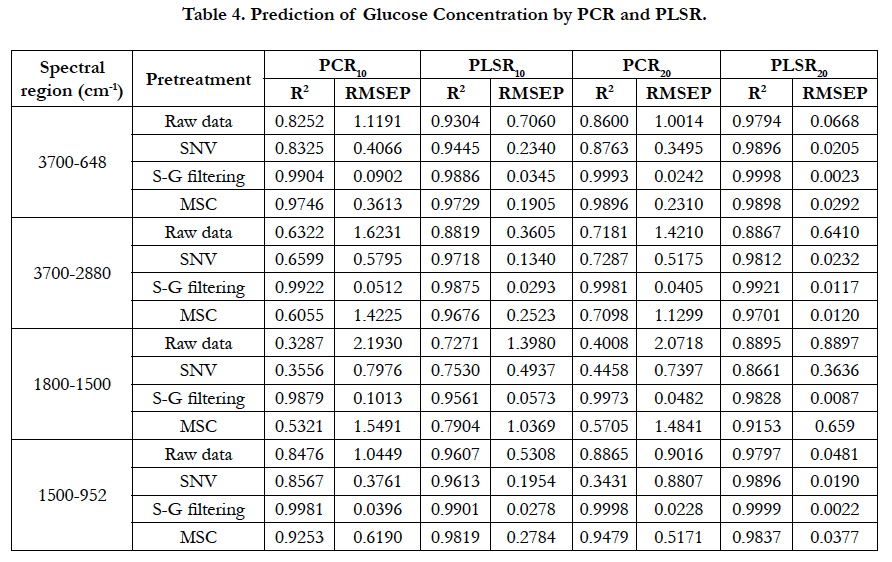
Table 4. Prediction of Glucose Concentration by PCR and PLSR.
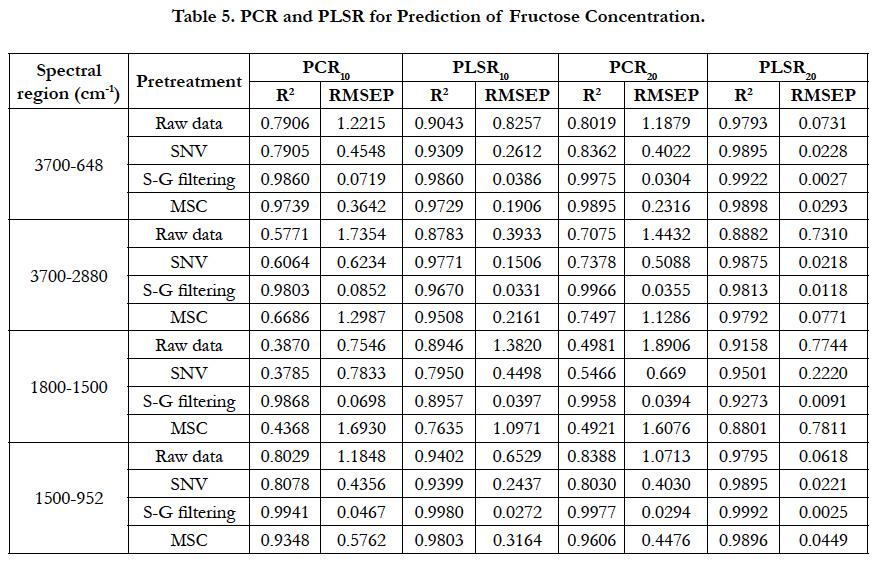
Table 5. PCR and PLSR for Prediction of Fructose Concentration.
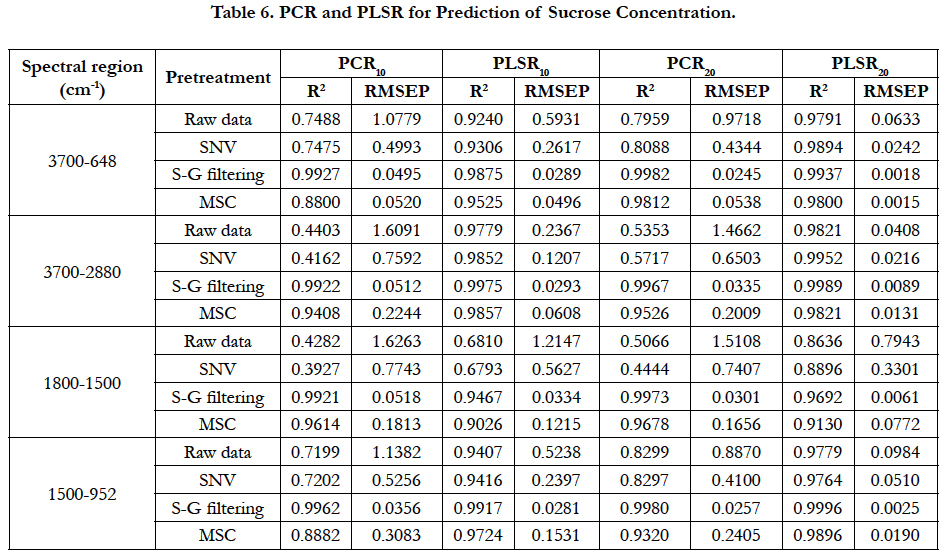
Table 6. PCR and PLSR for Prediction of Sucrose Concentration.
Prediction of simple sugars- glucose, fructose and sucrose is done after de-noising spectral data with SNV, S-G filtering and MSC. The PCR and PLSR models have been calibrated with full spectra and selected segments of spectra to select the best one among the alternatives.
It is noticed that, PLSR shows better results than PCR in all denoising techniques and in all spectral range (Table 4). Best prediction performance is noticed in PLSR with 20 latent variables. S-G filtering performs better than other two de-noising techniques (SNV and MSC) and raw data. Full spectra (3700-648 cm-1) and partial range 1500-952 cm-1 show better prediction performance (R2≈0.99) than other spectral ranges. Due to management and calculation simplicity, we are preferring shorter range, that is 1500-952 cm-1 as better performing region.
For prediction of fructose concentration in mango juices, PLSR performs better than PCR, and the best results are obtained with 20 latent variables (Table 5). Among de-noising techniques, S-G filtering is the best on the basis of R2 and RMSEP. All spectral ranges show very good prediction except 1800-1500 cm-1 (R2 ≈0.98).
Prediction results of sucrose concentration show similar results as those of glucose and fructose by PCR and PLSR (Table 6). Here, de-noising technique, S-G shows the best performance, and spectral range 1500-952 cm-1 is the most information region of the spectra (R2≈0.98).
To recapitulate, for prediction of glucose, fructose and sucrose, PLSR is better than PCR, and ANN performs better than PLSR. Savitzky-Golay (S-G) filtering shows the best performance to denoise FTIR spectral data for preprocess than before calibration. Lastly, spectral range 1500-952 cm-1 is the most informative part of the whole spectra for prediction of simple sugars in mango juice.
It is to be mentioned here that some amount of glucose, fructose and sucrose exists in ripe mango naturally. There is a base amount of these simple sugars in ripe mango of different varieties [1]. So amount of added sugars can easily be estimated by subtracting the base amount from the amount found in the proposed method.
Conclusion
It is evident from the results that FTIR spectral range 1500-982 cm-1 is the most informative region. Savitzky-Golay (S-G) filtering shows the best de-noising performance among the denoising techniques considered in the study. Among the calibration models, Artificial Neural Network (ANN) demonstrates the highest prediction efficiency for glucose, fructose and sucrose.
Therefore, a novel analytical method is being proposed for quantification of glucose, fructose and sucrose in commercial mango juice with the best alternatives of spectral data acquisition, preprocessing and calibration.
The proposed method is cost effective, time saving and do not generate any chemical waste as no standard chemical is used in this method. So, the method could save a huge amount of quality testing cost for mango juice producing companies, consumers and food quality regulating authorities.
References
- Ara R, Motalab M, Uddin MN, Fakhruddin ANM, Saha BK (2014) Nutritional evaluation of different mango varieties available in Bangladesh. Int Food Res J. 21(6): 2169-2174.
- Tandel RK (2011) Sugar Substitutes: Health controversy over perceived benefits. J Pharmacol Pharmacother. 2(4): 236-243.
- Blanco-Gomis D, Fernandez-Rubio P, Gutierrez-Alvarez MD, Mangas- Alonso JJ (1998) Use of high-performance liquid chromatografic-chemometric techniques to differentiate apple juices clarified by microfiltration and ultrafiltration. Analyst. 123(1): 125-129.
- Reid LM, O’Donnell CP, Kelly JD, Downey G (2004) Preliminary Studies for the Differentiation of Apple Juice Samples by Chemometric Analysis of Solid-Phase Microextraction-Gas Chromatographic Data. J Agricul Food Chemi. 52(23): 6891-6896.
- Helena R, Teresa S (2003) Determination of Saccharides in Multifloral Honey by means of HPLC. J Apicultural Sci. 47(2): 93-101.
- Bro R, Berg F, Thybo A, Andersen CM, Jorgensen BM, et al., (2002) Multivariate data analysis as a tool in advanced quality monitoring in the food production chain. Trends in Food Sci Technol. 13(6-7): 235–244.
- Iola FD, Barros A, Delgadillo I, Almeida C, Gil AM (2002) Application of FTIR Spectroscopy for the Quantification of Sugars in Mango Juice as a Function of Ripening. J Agricul Food Chem. 50(11): 3104–3111.
- Jha SN, Gunasekaran S (2010) Authentication of sweetness of mango juice using Fourier transform infrared-attenuated total reflection spectroscopy. J Food Eng. 101: 337-342.
- Horwitz W (2005) Official Methods of Analysis of AOC International. 18th (edn), Maryland, USA.
- Nicolai BM, Beullens K, Bobelyn E, Peirs A, Saeys W, et al., (2007) Nondestructive measurement of fruit and vegetable quality by means of NIR spectroscopy: A review. Postharvest Biology Technol. 46: 99−118.
- Rinnan A, Berg F, Englsen SB (2009) Review of the most common preprocessing techniques for near-infrared spectra. TrAC. 28(10): 1201-1222.
- Bhotmange M, Shastri P (2011) Application of Artificial Neural Networks to Food and Fermentation Technology, Artificial Neural Networks-Industrial and Control Engineering Applications. Intech open sci. 201-222.
- Otto M (1999) Chemometrics: Statistics and computer application in analytical chemistry. Hoboken, NJ: Wiley-VCH , 314.
- Lozano J, Santos JP, Aleixandre M, Sayago I, Gutierrez J, et al., (2006) Identification of typical wine aromas by means of electronic nose. IEEE Sensors J. 6(1): 173–178.
- Cozzolino D, Smyth HE, Lattey KA (2006) Combining mass spectrometry based electronic nose, visible-near infrared spectroscopy and chemometrics to assess the sensory properties of Australian Riesling wines. Analytica Chimica Acta. 563(1): 319–324.
- Goodacre R, Hammond D, Douglas BK (1997) Quantitative analysis of the adulteration of orange juice with using pyrolysis mass spectrometry and chemometrics. J Analy Appl Pyrolysis. 40: 135-158.
- Lopez-Diez CE, Bianchi G, Goodacre R (2003) Rapid Quantitative Assessment of the Adulteration of Virgin Olive Oils with Hazelnut Oils Using Raman Spectroscopy and Chemometrics. J Agric Food Chem. 51(21): 6145-6150.