Effects of General Anesthesia vs Regional Anesthesia on Neonatal Outcomes: A Systemic Review and Mata Analysis
Mekonnen S1*, Ahmed S2
1 Department of Anesthesiology, College of Health and medical Sciences, Dilla University, Ethiopia.
2 Dilla University Teaching and Referral Hospital, Gedeo Zone, Dilla, Ethiopia.
*Corresponding Author
Semagn Mekonnen
Department of Anesthesiology, College of Health and medical Sciences, Dilla University, Ethiopia.
Tel: +251913864605
E-mail: semmek17@gmail.com
Received: April 19, 2016; Accepted: June 07, 2016; Published: June 09, 2016
Citation: Mekonnen S, Ahmed S (2016) Effects of General Anesthesia vs Regional Anesthesia on Neonatal Outcomes: A Systemic Review and Mata Analysis. Int J Anesth Res. 4(6), 261-271.DOI : dx.doi.org/10.19070/2332-2780-1600057
Copyright: Mekonnen S© 2016. This is an open-access article distributed under the terms of the Creative Commons Attribution License, which permits unrestricted use, distribution and reproduction in any medium, provided the original author and source are credited.
Abstract
Backgrounds: Types of anesthesia provision and perioperative patient cares are the main determinants of neonatal outcome in mothers undergo caesarean section. Body of evidence didn’t clearly reveal which types of Anesthesia technique is associated with better neonatal outcomes in mothers who gave birth under spinal anesthesia than general anesthesia. The aim of this systemic review and meta-analysis was to compare neonatal outcomes in mothers who undergo caesarean section under general anesthesia and regional anesthesia.
Methods: We carried out a systemic search of the electronic databases of central, Medline, Embase, LILACS, AOLJ and others with PICO strategy for controlled clinical trials comparing neonatal outcomes under general and regional anesthesia. Twenty trials were identified for eligibility assessment, ten trials were selected for data extraction, and nine trials were finally included in the meta-analysis. All controlled clinical trials using regional and general anesthesia for ASA I-II term pregnant women coming for cesarean section in elective and semi-urgent condition were selected. Eligibility assessment was performed independently by the two review authors using a customized form, while discrepancies were resolved by consensus. The Data from individual trial were extracted and entered Review Manager for synthesis.
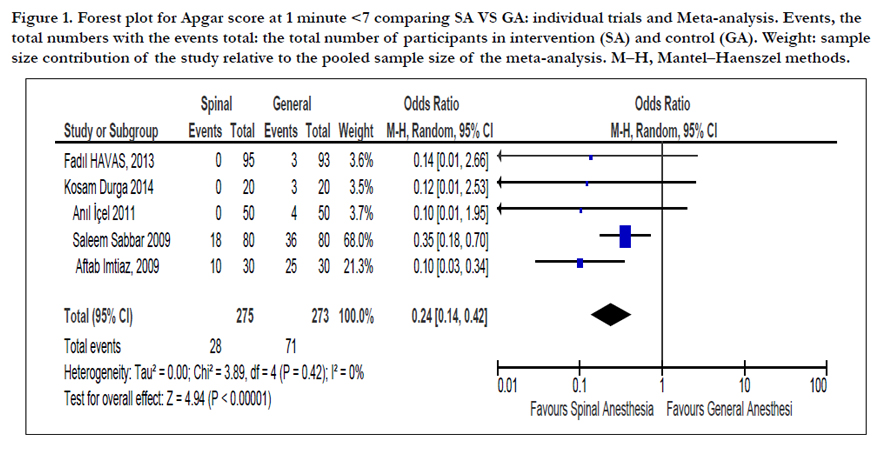
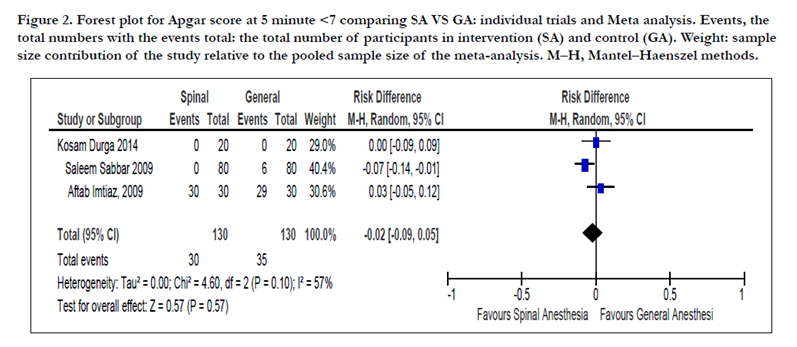
Results: Ten studies (782 participants) were included in this review. The Apgar score at one minute less than seven was better in spinal anesthesia as compared to General Anesthesia (OR=0.24, 95% confidence interval (CI) 0.14 to 0.42, 5 trials, 548 participants). There was no significant association at 5th minute Apgar score less than seven (OR= -0.02, 95% CI -0.09 to 0.05, 3 trials, 260 participants). There was significant mean difference between spinal and general anesthesia on neonatal mean Apgar score at 5th minute (MD=0.51, 95% CI 0.14 to 0.88, 5 trials, 671 participants).
There was a significant mean difference on Umbilical artery and Venous PH when general anesthesia is compared with
spinal anesthesia (MD= -0.01, 95% CI -0.002 top -0.00, one trial, 40 participants) and (MD= -0.98, 95% CI -1.66 to -0.30, one trial, 40 participants).
Conclusion: Regional Anesthesia is superior over general Anesthesia in certain neonatal outcomes as depicted by the pooled analysis of individual trials. However, there should be further review with individual trials having high power and similar dosage and techniques as most of the individual trials in this review are low powered and different types of outcome assessment techniques.
2.Abbreviations
3.Background
4.Objective
5.Criteria for Considering Studies for this Review
5.1 Types of study
5.2 Types of participants
5.3 Types of intervention
5.4 Types of Outcomes
6.Search methods for identification of studies for the review
7.Methods of the review
8.Description of studies
9.Results
9.1 Primary outcomes
9.2 Secondary outcomes
10.Quantitative data synthesis
11.Discussion
12.Conclusion
13.Acknowledgements
14.References
Keywords
Anesthesia; Apgar Score; Umbilical Artery PH; Umbilical Vein PH; Controlled Clinical Trial.
Abbreviations
AOLJ: African on Line Journal; BMI: Body Mass Index; CI: Confidence Interval; CMA: Comprehensive Meta-Analysis; ENNS: Early Neonatal Neurologic Score; ICU: Intensive Care Unit; LILACS: literature In Health Science In Latin America and Caribbean; MN: Mean Deviation; NACS: Neurologic Adaptive Capacity Score; OR: Odd Ratio; Revman: Review Manager; RR: Relative Risk; SD: Standard Deviation; SMD: Standardized Mean Difference.
Background
Obstetric Anesthesia is a demanding but challenging subspecialty of anesthesiology and it requires special skills because two lives are involved at the same time at any time of the day. The choice of Anesthesia, either general or regional Anesthesia, for cesarean section depends upon indication for operation, its urgency, and preference of patients, obstetrician and anesthetist [1,2]. Both general and spinal Anesthesia are not ideal for cesarean section because each has advantages and risk to fetus. However, the plan of anesthetist is to choose the method which is safest and most comfortable for the mother, least depressant to the newborn and which provides optimal working conditions for the obstetrician [2-4].
Spinal anesthesia affects neonates either by decreasing uteroplacental perfusion secondary to sympathetic blocked induced hypotension or intratecally administered Opioids with local anesthetics that depress the respiratory center and end up with asphyxia and acidosis [3,4].
The effect of general anesthesia on neonate depends on intravenous agent, dosage of the agent and the total induction delivery time [1,5].
According to a study conducted in India, the higher the induction delivery time the lower the Apgar score was in general anesthesia than regional anesthesia and the mean Early neonatal neurobehavioral score was higher in spinal (30 ± 1.3), general (28.3 ± 1.76 and epidural (28.4 ± 1.93) respectively [5].
The effect of types of Anesthesia on neonatal outcomes is uncertain that some studies showed no difference in neonatal outcomes between regional and general Anesthesia [6,7] and others showed that neonatal outcomes are better in regional Anesthesia than general Anesthesia [3-5],8-20].
It is very important to know the types of Anesthesia with better neonatal outcomes despite the risks and benefits of each type of Anesthesia.
Objective
To compare effects of General Anesthesia and Regional Anesthesia on Neonatal outcomes.
Criteria for Considering Studies for this Review
Randomized controlled trials.
ASA I and II full term pregnant women with no fetal distress and abnormality coming for elective or emergency cesarean section When the mean cervical dilatation and effacement were compared in Group E and Group C, the difference was statistically insignificant (p > 0.05).
Babies delivered with cesarean section under regional Anesthesia (spinal, epidural or combined spinal-epidural).
Babies delivered with cesarean section under General Anesthesia.
The primary outcomes were Apgar score at first and fifth minute less than seven, Apgar score at first and fifth minute greater than seven, mean Apgar score at first and fifth minute and umbilical blood gas analysis.
The secondary outcomes were Neurobehavioral Adaptive capacity Score, need for resuscitation, hypoglycemia and phototherapy.
Search methods for identification of studies for the review
Ethical clearance was obtained from Dilla University research and dissemination office. We carried out a systemic search of the electronic database: central, Medline, Embase, LILACS, AOLJ and others with PICO strategy as described in methodology.
The search was restricted to full reports of randomized controlled trials published in peer-reviewed journals without excluding trials published in languages other than English and no date restriction was applied up to April 2015. Trials studying ASA I and II mothers with no fetal distress coming for elective or emergency caesarean section were incorporated in the Meta analysis.
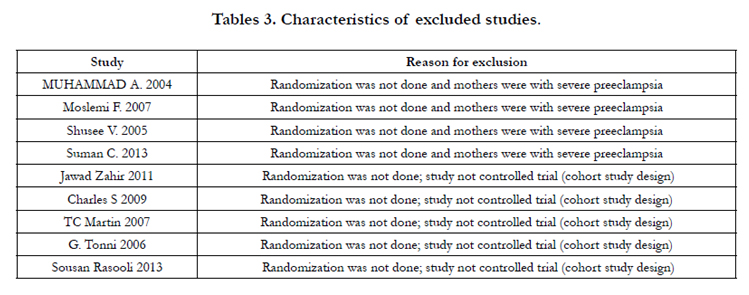
Eligibility assessment was performed independently by the two review authors using a customized form, while discrepancies were resolved by consensus. Two Authors independently assessed each trial for inclusion in the review using the information described in the section 'Criteria for considering studies for this review' and Studies that did not meet the inclusion criteria were excluded and the reason was stated in the table of 'Characteristics of excluded studies'(Table 2).
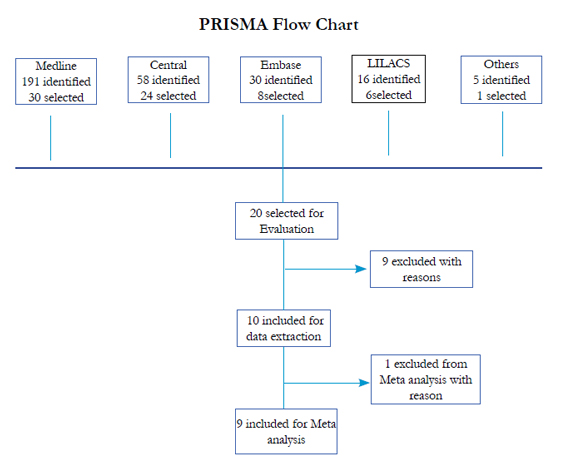
We prepared a flow diagram to summarize the study selection process according to PRISMA chart.
As it has been mentioned in methodology, the two Authors searched independently the five major databases and some others. Trials identified through the search were given a code depending on the topic. We searched the database for potential eligibility studies without year and language restriction with medical subject heading (MeSH) terms of Neonate, Apgar, outcome, umbilical blood gas, Neonatal Adaptive capacity score and Ph as follows:
- general
- regional
- spinal
- epidural
- #1 and (#2 or #3 or #4)
- Anesthesia*
- #5 and #6
- cesarean section*
- #8 and #9
- random*
- controlled-clinical-trial
- #12 or #13
- #11 and #14

Methods of the review
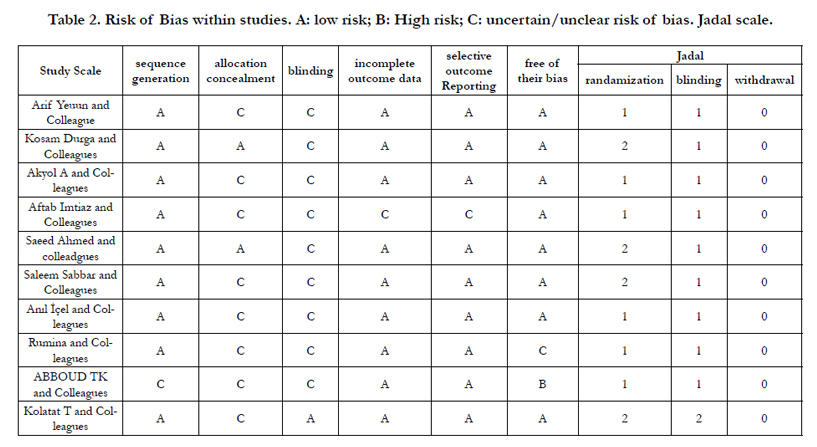
Semagn Mekonnen (SM) selected potentially relevant trials from those identified by the search strategy and retrieved the full articles and multiple publications from the same data set were only used once. SM and Siraji Ahmed (SA) independently assessed each trial for inclusion in the review using the information described in the section Criteria for considering studies for this review. Studies that did not meet the inclusion criteria were excluded and the reasons were stated in the table of Characteristics of excluded studies’. SM and SA independently assessed the methodological quality of the included trials which were measured by Generation of allocation sequence, allocation concealment, blinding and loss to follow up. For all trials, each quality component apart from blinding were classed as adequate, inadequate or unclear, (Table 1). For allocation concealment, the letters A to D were used: where A = adequate, B = unclear, C = inadequate and D = not used. For loss to follow up, inclusion of 90% of participants was considered adequate. Blinding was assessed using the following criteria: blinding of participants, blinding of Health care providers and blinding of outcome assessment. Blinding was assessed as open or single blind. Disagreements between Authors were resolved by discussion.
Statistical combination of data from two or more separate trials in a meta-analysis was decided based on the evaluation of the clinical and methodological heterogeneity. The inconsistency throughout trials were quantified with the I2 statistic proposed by Higgins and colleagues, assuming a value more than 50% as a substantial heterogeneity.
The summary effect measure were risk ratio (RR) and odd ratio for dichotomous variables and mean Difference and standard deviation for continuous variables along with their corresponding 95% confidence intervals (CI). The meta-analysis was planned to be performed through a random-effects model and Mantel– Haenszel (M–H) statistical method, anticipating that trials would have different techniques and assuming that the actual true effects have a normal distribution.
The data Analysis was conducted using Review Manager (RevMan 5.3, Cochrane Collaboration) and Comprehensive Meta-Analysis (CMA). This systematic review was carried out using the methods established by the Cochrane Handbook for Systematic Reviews of Interventions and we followed the recommendations and checklist items from the PRISMA Statement for Reporting Systematic Reviews and Meta-analysis.

Description of studies
The search strategies identified 300 trials from different data bases as mentioned in the methodology section (Figure 1). After a process of successive screening for eligibility, 20 studies were selected for more detail evaluation. With subsequent screening, 10 studies with 782 participants were included for analysis and the rest were excluded with reasons (Table 3).
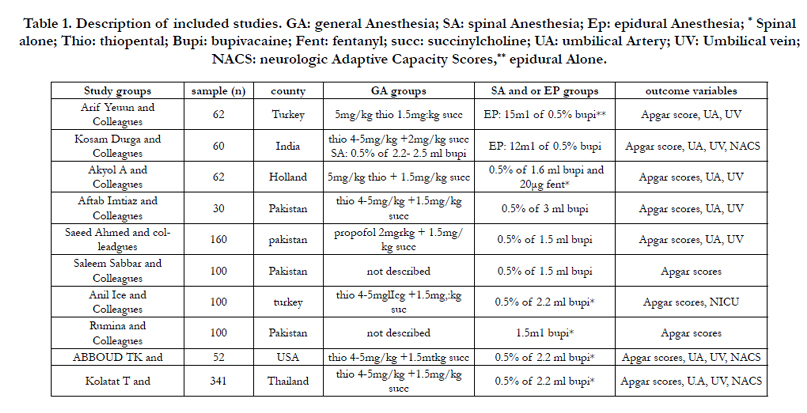
The 10 studies analyzed were published between 1985-2014 and they were performed in South America, Europe and Asia. The mean age of included studies ranged from 27-31years. Whereas the mean weight reported was 61-74 kg in four studies. The BMI of included studies was reported in four studies which were ranged from 25.4-29kg/m2. Sample size ranged from 52-188 participants and only two studies had large sample size of 160 and 188. In six studies the neonatal outcomes were compared with General and spinal Anesthesia where as general, spinal and epidural anesthesia was compared for neonatal outcomes in three studies. Only one study compared neonatal outcomes with General and epidural Anesthesia.
General Anesthesia was induced with 4-6mg/kg thiopental and 1.5-2mg/kg succinylcholine in nine studies. Only one study was performed with propofol intravenous agent. Spinal Anesthesia was conducted with 0.5%-0.75% bupivacaine. The details were described in tables of excluded studies (Table 3).
Results
The immediate outcomes of neonates were assessed with Apgar score and umbilical blood gas analysis and that was why the included studies primary outcomes were Apgar score and Umbilical blood gas analysis results. The 10 included studies reported the 1st and 5th minute Apgar scores and of which five studies [3,5,8-10] reported as mean ± SD whereas the rest five reported as range of values. Neonatal umbilical blood gas was reported in five studies [4,6,7,9,11]. In six studies [3,4,8,10,11,14] the first minute Apgar score is better in spinal anesthesia than general anesthesia whereas there were no significant different in the first minute Apgar score in two studies [6,7] in whichever type of Anesthesia, general vs regional (spinal and epidural). In only one study [4], the Fifth minute Apgar score was better in spinal anesthesia whereas there were no difference in nine studies on the fifth minute Apgar score. The umbilical blood gas analysis were not significantly different in three studies [4,10,14] under general and spinal anesthesia. However, the blood gas analysis were better in regional anesthesia than general anesthesia in two studies [6,7].
The neonatal neurobehavioral response was reported in three studies with different assessment tools. Two studies reported neonatal neurobehavioral response with neonatal adaptive capacity score [10,11] which was measured at 15minute, 2hrs and 24hrs and babies delivered under general anesthesia had lower NACS as compared to Epidural and spinal groups but there were no difference at 24hrs where as one study reported with Early Neonatal Neurobehavioral Score [5].
Neonatal ICU admission was reported only in one study [9]. The numbers of neonates admitted to Neonatal ICU were higher in spinal 6(12%) as compared to general anesthesia which was 5 (10%) neonates.
Respiratory support requirement to neonate was reported in one study [14] and there was no significant difference between General anesthesia 4 (4.4%) and Spinal anesthesia groups 4 (4.2%).
Incidence of hypoglycemia and requirement of phototherapy were reported in one study [14] and there was no significant difference between neonates delivered with general or spinal Anesthesia.
Requirement of neonatal resuscitation at birth was reported in one study [5] and three babies out of twenty required resuscitation at birth who delivered with General Anesthesia as compared to Spinal and Epidural anesthesia who didn’t require resuscitation at all.
Quantitative data synthesis
Regional Anesthesia and General anesthesia were compared as intervention and control respectively using Apgar score and umbilical blood gas analysis as the primary outcomes. Nine studies were included for meta-analysis.
In the pooled Analysis, The Apgar score at one minute less than seven was better in spinal anesthesia when compared to General Anesthesia (OR=0.24, 95% confidence interval (CI) 0.14 to 0.42, 5 trials, 548 participants) [3,5,8,9,14] (Figure 1). However, there was no significant association at 5th minute Apgar score less than seven (OR= -0.02, 95% CI -0.09 to 0.05, 3 trials, 260 participants) [3,5,8](Figure 2).
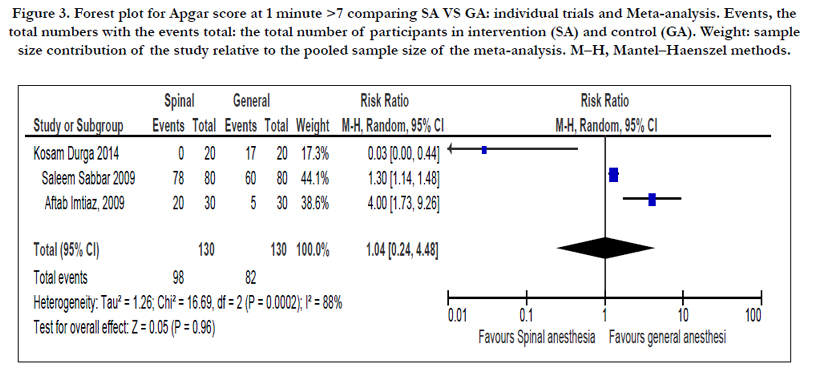
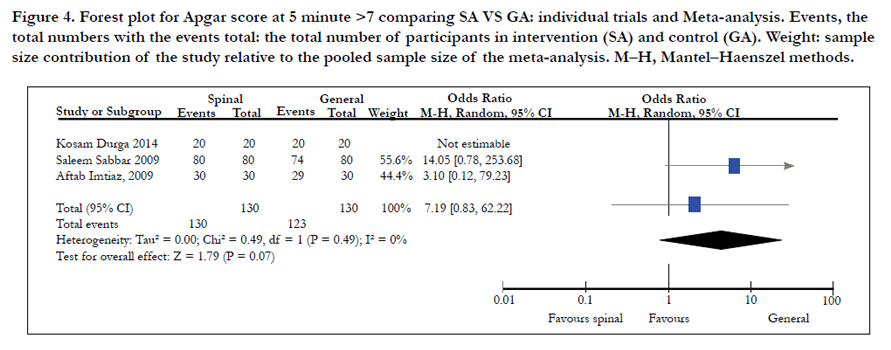
There was no significant association between spinal and general anesthesia on neonatal Apgar score at 1st and 5th minute greater than seven (OR= 1.04, 95% CI 0.24 to 4.48, 3 trials, 260 participants) and (OR= 7.19, 95% CI 0.83 to 62.22, 3 trial, 260 participants) respectively [3,5,8] (Figure 3&4).
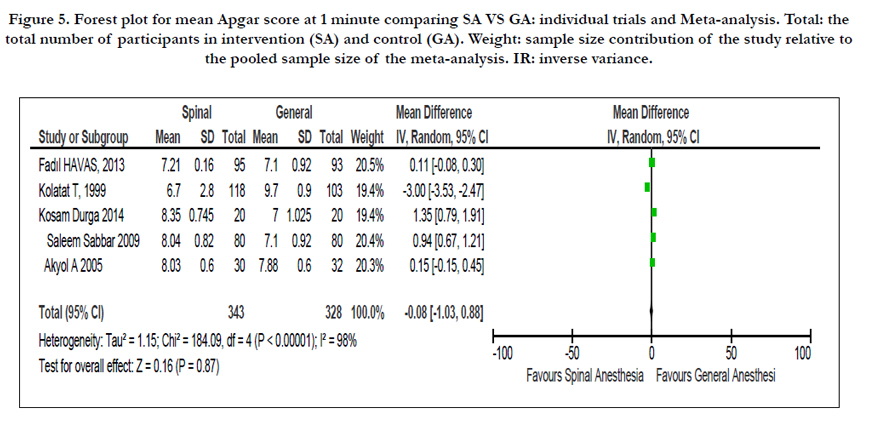
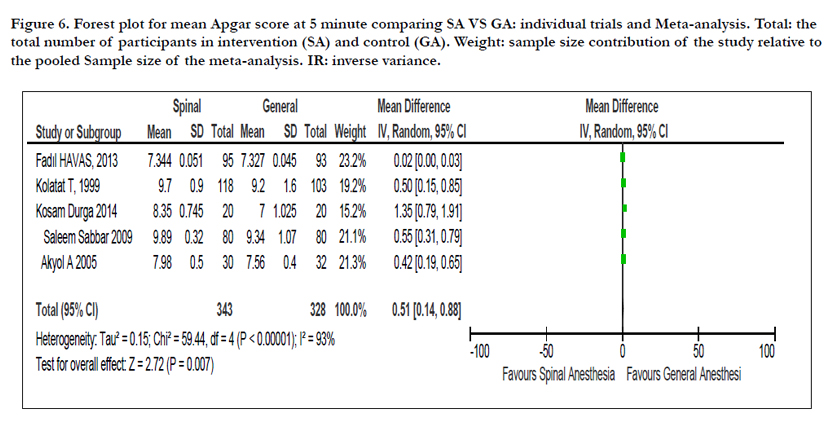
There was no significant mean difference on neonatal mean Apgar score at 1st and 5th minutes between spinal and General anesthesia (MD= -0.08, 95% CI -1.03 to 0.88, 5 trials, 671 participants) [3,5,7,11,14] (Figure 5). However, there was significant mean difference between spinal and general anesthesia on neonatal mean Apgar score at 5th minute (MD=0.51, 95% CI 0.14 to 0.88, 5 trials, 671 participants) [3,5,7,11,14] (Figure 6).
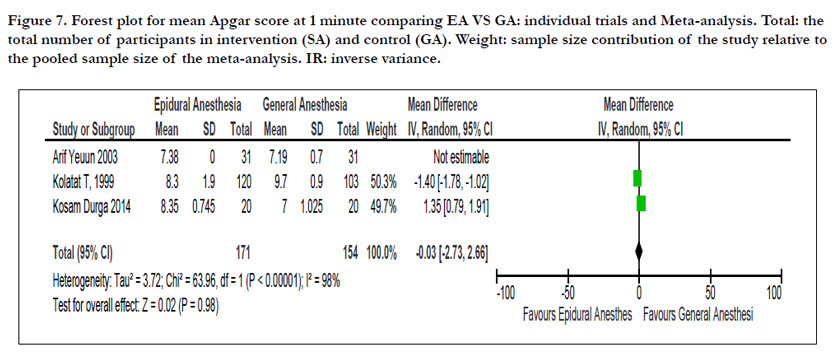
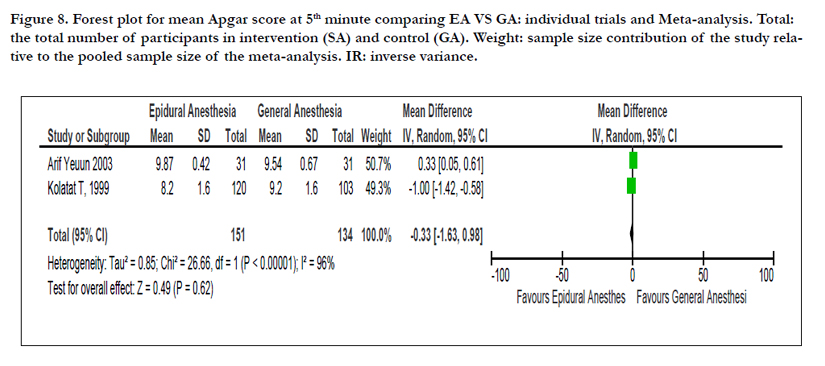
There was no significant mean difference between Epidural and General Anesthesia on neonatal mean Apgar score at 1st and 5th minutes (MD=-0.03, 95% CI -1.03 to 2.66, 3 trials, 325 participants) [5,6,11] (Figure 7) and (MD= -0.33, 95 % CI -1.63 to 0.98, 2 trials, 285 participants) respectively [6,11] (Figure 8).
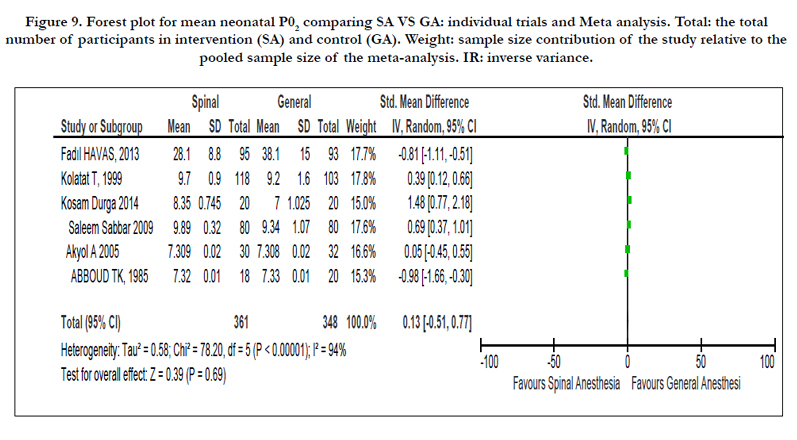
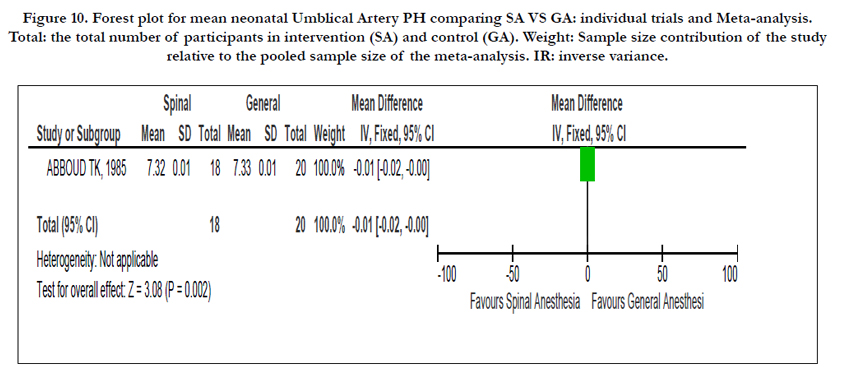
Six studies reported on neonatal umbilical arterial oxygen tension and noted that there was no difference in the standard mean difference (SMD) of umbilical arterial oxygen tension when general anesthesia is compared with spinal anesthesia (SMD=0.13, 95% CI -0.51 to 0.77, 6 trials, 709 participants) [3,5,7,10,11,14] (Figure 9). One study reported on umbilical artery and Venous PH and noted that there was a mean difference when general anesthesia is compared with spinal anesthesia (MD=-0.01, 95% CI -0.002 top -0.00, one trial, 40 participants) and (MD= -0.98, 95% CI -1.66 to -0.30, one trial, 40 participants) [10] (Figure 10).
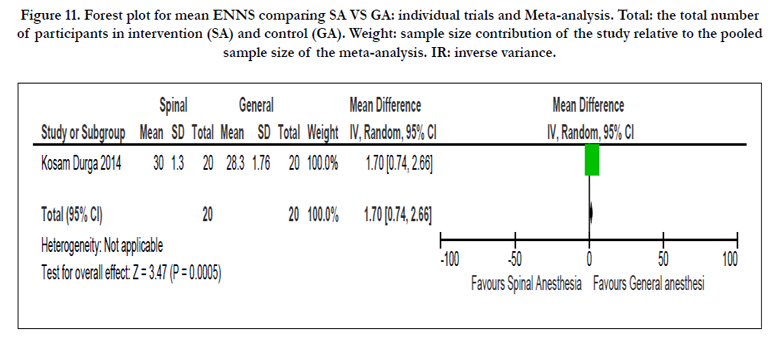
One study reported Early Neonatal Neurobehavioral Score (ENNS) and noted that there was a significant mean difference when general anesthesia is compared with spinal anesthesia (MD= 1.70, 95% CI 0.24 to 2.66, one trial, 40 participants) [5] (Figure 11).
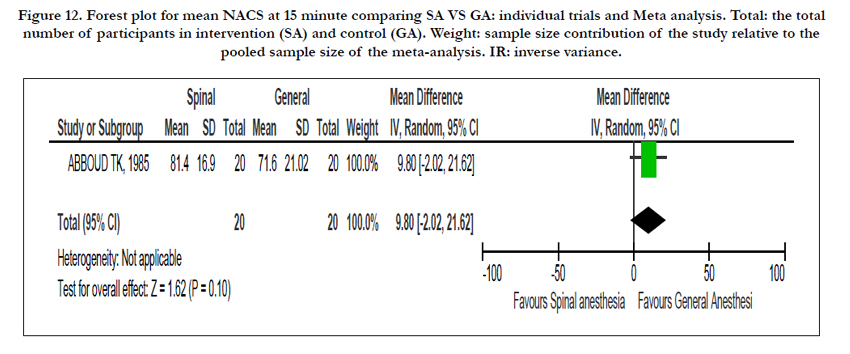
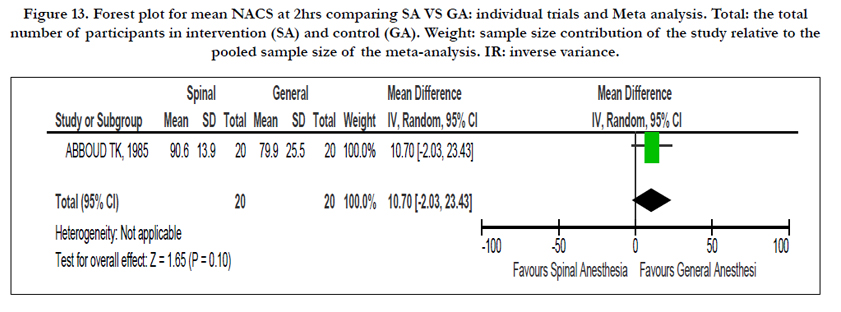
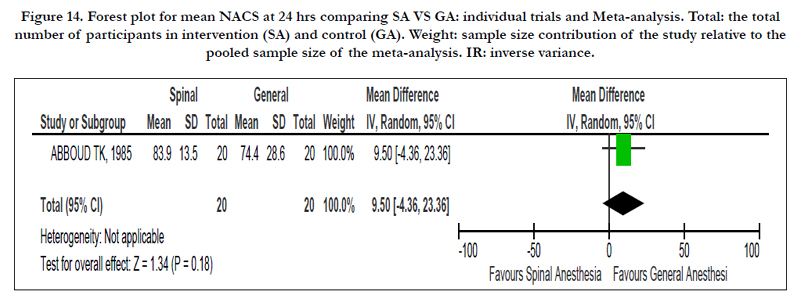
One study reported neonatal neurobehavioral Adaptive capacity score (NACS) in 15 minutes, 2hrs and 24hrs and noted that there were no difference when general anesthesia is compared with general anesthesia (MD= 9.8, 95% CI -2.02 to 21.62, one trial, 40 participants), (MD= 10.70, 95% CI -2.03 to 23.43, one trial, 40 participants) and (MD= 9.5, 95 % CI -4.36 to 23.36, one trial, 40 participants) respectively [10] (Figure 12, 13 &14).
Discussion
No trial reported on neonatal death and this may indicate the relative safety of cesarean section particularly in the countries where the included studies conducted. Larger sample size would also be required to detect such outcome as most of the included studies were underpowered. In this review, spinal anesthesia appears to be associated with better first minute Apgar score (less than seven Apgar score) as compared to general Anesthesia. However, the mean Apgar score at first and fifth minute didn’t show any significant difference when general anesthesia is compared with regional (spinal and epidural) anesthesia.
In pooled analysis, the umbilical arterial and venous PH were higher in regional anesthesia when compared to general anesthesia, but in other review [2] the Umbilical arterial PH didn’t show any significant different unlike the Umbilical venous PH which is in line with this review.
The early neonatal neurobehavioral score was higher in spinal anesthesia as compared to general anesthesia. However, neonatal neurobehavioral Adaptive Capacity score at 15min, 2hr and 24hr didn’t show any significant difference between general and spinal anesthesia.
Incidence of neonatal ICU admission was higher in spinal anesthesia unlike a systemic review conducted by Cochrane collaboration where neonatal ICU admission is higher in general anesthesia as compared to regional (spinal and epidural) anesthesia and this discrepancy might be due to the low power in this review.
Need for resuscitation was significantly associated with general anesthesia when compared with regional anesthesia. However, a systemic review conducted by Cochrane collaboration didn’t show any significant difference when general anesthesia is compared to regional (spinal and epidural) anesthesia [2]. Although regional anesthesia is associated with better neonatal outcomes, there is insignificant difference on neonatal outcomes when general anesthesia is compared with regional anesthesia in elective and semi-urgent cesarean section.
Conclusion
This review shows that Regional Anesthesia (epidural and spinal) is superior over general Anesthesia in certain neonatal outcomes as depicted by the pooled analysis of individual trials. However, there should be further review with individual trials having high power and similar dosage and techniques as most of the individual trials in this review are low powered and different types of outcome assessment techniques which brings high risk of bias and heterogeneity and difficult to come up with strong conclusion. Overall, the choice of Anesthesia technique for cesarean section would depend on the resource availability, set up of the institution and the skill of the Anesthesiology professional.
Acknowledgements
The authors thank Dr. Henok Taddesse for his valuable encouragement in the development and accomplishment of this research project.
References
- Barash Paul G, Cullen Bruce F, Stoelting, Robert K, Cahalan Michael K , Stock M Christine (2009) Handbook of Clinical Anesthesia. (6th edn), Lippincott Williams & Wilkins, Philadelphia. 697-702.
- Afolabi BB, Lesi FEA, Merah NA (2006) Regional versus general anesthesia for caesarean section. Cochrane Database Syst Rev 4: 1-7.
- Tabassum R, Sabbar S, Khan fa, Shaikh JM (2010) Comparison of the effects of general and spinal anaesthesia on apgar score of the neonates in patients undergoing elective caesarean section: pak j surg 26(1): 46-49.
- Solangi SA, Siddiqui SM, Khaskheli MS, Siddiqui MA (2012) Comparison of the effects of general vs spinal anesthesia on neonatal outcome. Anaesth Pain & Intensive Care16 (1): 18-23.
- Kosam d, kosam a and murthy m (2014) Effect of various techniques of anesthesia in elective caesarian section on short term neonatal outcome. international journal of medical research and review 2(5): 480-486.
- N aye, ertu z, yilmaz m and erman m (2003) The effects of epidural anesthesia and general anesthesia on newborns at cesarean section. turkish journal of medical sciences 33: 311-314.
- Akyol A, Akgun A, Gedikbasi A, Agrali G, Ceylan Y (2006) Effects of general and spinal anesthesia on APGAR scores and Umbilical cord blood gases in elective cesarean operations. Cochrane register of controlled trials. 20(1): 32-37.
- Imtiaz A, Mustafa S, Haq N, Ali S, Imtiaz k (2009) Effect of spinal and general anaesthesia over apgar score in neonates born after elective cesarean section. jlumhs 9(3): 151-154.
- I Ais, Ii öö, Iii ig, Iv he, V Em et al., (2015) Comparison of maternal and fetal outcomes among patients undergoing cesarean section under general and spinal anesthesia : a randomized clinical trial comparação dos resultados maternos e fetais em pacientes submetidos a cesariana sob anestesia geral e raquianestesia : um ensaio clínico randomizado.sao paulo med j 133(3): 227-234.
- Abboud Tk, Nagappala S, Murakawa K, David S, Haroutunian S et al., (1985) Comparison of the effects of general and regional anesthesia for cesarean section on neonatal neurologic and adaptive capacity scores. journal of anesthesia analgesia 64(10): 996-1000.
- Kolatat T, Somboonnanonda a, lertakyamanee j, Chinachot T, Tritrakarn T et al., (1999). Effects of general and regional anesthesia on the neonate. j med assoc Thai 82(1):40-45.
- Tonni G, Ferrari B, Felice C de, Ventura A (2007) Fetal acid-base and neonatal status after general and neuraxial anesthesia for elective cesarean section. international journal of obstetrics and gynecology 97(2): 143-146.
- Martin TC, Bell P, Ogunbiyi O (2007) Comparison of general anaesthesia and spinal anaesthesia for caesarean section. west indian medical journal 56(4): 330-333.
- Sungur Mo, Karaden M, Kili M, Seyhan Z (2013) Spinal anesthesia for elective cesarean section is associated with shorter hospital stay compared to general anesthesia 25(2): 55-63.
- Saatsaz S, Moulookzadeh S, Rezaei R, Khani N (2014) Comparison of neonatal apgar score in general. indian journal of fundamental amd applied life science 4(3): 351-357.
- Jawad zahir, Shazia Syed, Nadia Jabeen, Qudsia Anjum, Shafiq Ur et al., (2011) Maternal and neonatal outcome after spinal versus general anaesthesia for caesarean delivery. ann. pak. inst. med. Sci 7(3): 115-118.
- Rasooli S, Moslemi F (2014) Apgar scores and cord blood gas values on neonates from cesarean with general anesthesia and spinal anesthesia. journal of anal research clinical medicine 2(1): 11-16. doi:10.5681/jarcm.2014.002.
- Visalyaputra S, Rodanant O, Somboonviboon W, Tantivitayatan K, Thienthong S et al., (2005) Spinal versus epidural anesthesia for cesarean delivery in severe preeclampsia: a prospective randomized, multicenter study. anesth analg 101(3):862-868.
- Chattopadhyay S, Das a, Pahari S (2014) Fetomaternal outcome in severe preeclamptic women undergoing emergency cesarean section under either general or spinal anesthesia. Journal of Pregnancy Volume, Article ID 325098.
- Ahsan-ul-haq M (2004) Analysis of outcome of general versus spinal anaesthesia for caesarean delivery in severe pre-eclampsia with foetal compromise. Journal of biomedical 20: 1-8.