Associations of Binge Drinking and Smoking with Type 2 Diabetes among Adults in California: Age and Race Differences
Ke-Sheng Wang1*, Liang Wang1, Xuefeng Liu1, Daniel Owusu1, Mengxi Zhang2
1 Department of Biostatistics and Epidemiology, College of Public Health, East Tennessee State University, Johnson City, TN 37614, USA.
2 Department of Global Health Systems and Development, Tulane School of Public Health & Tropical Medicine, New Orleans, LA 70112, USA.
*Corresponding Author
Ke-Sheng Wang,
Department of Biostatistics and Epidemiology,
College of Public Health,
East Tennessee State University,
Johnson City, TN 37614, USA.
Tel: +1 423 439 4481
Fax: +1 423 439 4606
E-mail: wangk@etsu.edu
Article Type: Research Article
Received: April 09, 2014; Accepted: May 07, 2014; Published: May 09, 2014
Citation: Wang KS et al., (2014) Associations of Binge Drinking and Smoking with Type 2 Diabetes among Adults in California: Age and Race Differences. Int J Diabetol Vasc Dis Res. 2(4), 57-62. doi: dx.doi.org/10.19070/2328-353X-1400011
Copyright: Wang KS© 2014. This is an open-access article distributed under the terms of the Creative Commons Attribution License, which permits unrestricted use, distribution and reproduction in any medium, provided the original author and source are credited.
Abstract
Objective: The incidence of type 2 diabetes (T2D) is rising rapidly in the world. Findings focusing on the impact of two main lifestyle factors, smoking and alcohol consumption, on T2D were mixed. We aimed to estimate the prevalence of T2D and to examine the association of lifestyle factors including smoking and binge drinking with T2D.
Materials and Methods: 4046 adults with T2D and 38234 controls were selected from the 2011-2012 California Health Interview Survey (CHIS). Weighted univariate and multiple logistic regression analyses were used to estimate the odds ratios (ORs) with 95% confidence intervals (CIs).
Results: The overall prevalence of T2D was 7.0% (7.2% for males and 6.8 % for females). The prevalence increased with age (1.7%, 10.3% and 17.2% for age group 18-44, 45-64 and 65+ years, respectively). Multiple logistic regression analysis showed that past smoking (OR = 1.28, 95% CI = 1.13-1.45), middle-aged adults (OR = 6.23, 95% CI = 5.09-7.62) and elderly adults (OR = 10.38, 95% CI = 8.28-13.0), nonwhite (Latino, Asian, and Africa American), obesity and poor poverty were positively associated with T2D. Furthermore, being female (OR = 0.76, 95% CI = 0.67-0.86), binge drinking (OR = 0.67, 95% CI = 0.57-0.80), and employment were negatively associated with T2D. Stratified by age and race, obesity was positively associated with T2D in all age and race groups. Past smoking was positively associated with T2D in middle-aged Asian and Whites groups only. Binge drinking showed negative association with T2D in the middle-aged and elderly Whites and in the elderly Asians.
Conclusion: Lifestyle factors (binge drinking and smoking) were associated with T2D. There were age and race differences in the associations of binge drinking and smoking with T2D.
2.Introduction
3.Materials and Methods
3.1 Study population
3.2 Measurements
3.3 Statistical Analysis
4.Results
4.1 Subjects characteristics and prevalence of T2D
4.2 The relationship between potential risk factors and T2D
4.3 Risk factors of type 2 diabetes in different age and racial groups
5.Discussion
6.Conclusion
7.Acknowledgements
8.References
Key Words
Type 2 Diabetes; Binge Drinking; Smoking; Age Difference; Race Difference.
Introduction
As a predominant form of diabetes, type 2 diabetes (T2D) has been a major public health issue that threatens health and economies [1]. According to the international diabetes federation (IDF) estimation, there were 284.6 million of patients with diabetes in 2010 in the world [2] and it was predicted that there would be 438.4 million in 2025, with about 90%-95% being T2D. The overall prevalence of T2D in United States (US) was 7.7% based on the 2003-2004 National Health and Nutrition Examination Survey (NHANES) [3], while the prevalence was 6.8% based on the 1997-2004 NHANES and varied by race (5.5%, 11% and 11% for non-Hispanic White, non-Hispanic Black and Mexican American, respectively)[4]. The health expenditure for diabetes will rise from 418 USD billion to 490 USD billion from 2010 to 2030 [5]. As a highly preventable disease, the epidemic of T2D can be relieved through updating public policies, treatments, and living environments which target specific risks. The disparity of T2D in diverse racial/ethnic groups has been proven from studies that have been conducted in the US [4, 6], yet limited studies have investigated age and race differences in multiple factors of T2D. T2D risk factors include family history, ethnic background, age, being overweight and lack of physical activity [7-9]. However, the pathogenesis of this disease is very complex and remains unknown. In particular, the impact of two main lifestyle factors, smoking and alcohol consumption, on T2D has inconsistent findings and has not been compared in different age and racial/ethnic groups [4, 7],[10-12]. In order to decrease the disparity of T2D among different races/ ethnicities and to have the effective prevention and treatment of T2D, we investigated the age and race differences in the associations between lifestyle factors including smoking and alcohol consumption and T2D using a large population-based sample.
The California Health Interview Survey (CHIS) is a collaborative population-based telephone survey which is conducted by the University of California, Los Angeles (UCLA) Center for Health Policy Research, the California Department of Health Services, and the Public Health Institute. The 2011-2012 CHIS is the sixth CHIS data collection cycle since 2001. The cross-sectional survey consisted of two stages:
(1) a sample of telephone numbers selected by use of a list-assisted random-digit-dial method,
(2) one adult who was 18 years of age or older was randomly selected among all adults in the household as the respondent. Extensive information for all age groups on health status, health conditions, health-related behaviors, health insurance coverage, access to health care services, and other health and health related issues were collected by CHIS. Details about the sampling design, data collection methods, dataprocessing procedures, response rate and weighting and variance estimation could be found at elsewhere [13]. Procedures for data collection and analysis were approved by the Institutional Review Boards (IRBs) at the participant universities and agencies. The current study was approved by the IRB of authors’ university.
T2D was determined by the question “Were you told that you have Type 1 or Type 2 diabetes?” Only adults with T2D were included in this study. Controls were defined to those who responded “No” to the question.
Smoking behavior was classified as never smoking, current smoking, or past smoking. Other behavioral factors were dichotomized
into either yes or no, including binge drinking and obesity. Binge drinking was defined as five or more drinks for males, and four or more drinks for females in one occasion at least once a year. Obesity was identified with a Body Mass Index (BMI) of 30.0 or above, which was calculated as weight in kilograms divided by squared height in meters.
Gender was self-reported as male or female. The age was classified as young (18-44 years), middle aged (45-64 years), and elderly (65 years or above). Employment status was dichotomized into either yes or no. The categories of race were White, Latino, Asian, and African American (AA) and other. Socioeconomic status (SES) was captured by annual income as a categorical variable in four levels using Federal Poverty Level (FPL), including 0-99 % FPL, 100-199 % FPL, 200-299 % FPL, and 300% FPL or above.
SPD is a nonspecific measure of psychological distress that has been psychometrically validated and shown to be able to discriminate community Diagnostic and Statistical Manual of Mental Disorders, Fourth Edition (DSM-IV) cases from noncases [14,15]. SPD is determined using the Kessler 6 (K6) scale, which comprises 6 questions asking how often during the past 30 days a person felt “so sad that nothing could cheer them up,” “nervous,” “restless,” “hopeless,” “worthless,” or that “everything was an effort.” Responses are scored from 0 (none of time) to 4 (all the time) and summed to produce a total score (0 to 24), with a score of 13 or above used to define SPD [14]. The K6 has been used widely to screen for DSM-IV mood and anxiety disorders in the general population [16, 17].
The SAS PROC SURVEYFREQ procedure was used to weight and estimate population proportions in cases and controls. SAS PROC SURVEYMEANS was used to estimate the overall prevalence while SAS PROC SURVEYFREQ was used to determine the prevalence of demographic factors. The Chi-square test was used to compare the prevalence of T2D across age, gender, and races. Then, SAS PROC SURVEYLOGISTIC was used to estimate the odds ratios (ORs) and 95% confidence intervals (CIs) for the association between potential factors and T2D. Two models were conducted. In model one, simple logistic regression was used to examine the role of potential risk factors in T2D; then multiple logistic regression was used to adjust for all potential risk factors of T2D (full model). In model two, the full model was stratified by age and race. All the analyses were conducted with SAS statistical software, version 9.2 (SAS Institute, Cary, NC, USA).
Table 1 presents characteristics of participants by cases and controls. For the subjects who were 45-64, 65 years or older, the percentage was higher in cases than controls (49% vs. 32%, 38% vs.14%, respectively). The majority were whites in both groups (41% vs. 46%), followed by Latinos, Asians, and AAs (26% vs. 24%, 11% vs. 14%, 8% vs. 6%). The percentage of current smoking was similar in each group (12% vs. 14%). Diabetic group had higher percentage of past smoking, obesity, SPD, or unemployment than nondiabetic group (36% vs. 22%, 49% vs. 23%, 6% vs. 4%, 62% vs. 36%, respectively), and lower percentage of binge drinking or physical activity (16% vs. 32%, 59% vs. 64%, respectively). Around half of the participants were above 300% FPL. The overall prevalence of T2D was 7.0% (7.2% for males and 6.8 % for females) (Table 2). The prevalence increased with age (1.7%, 10.3% and 17.2% for age groups 18-44, 45-64 and 65+ years, respectively). The prevalence in Whites (6.4%) was higher than Asians (5.5%) but lower than Latinos (7.5%) and AAs (9.7%).
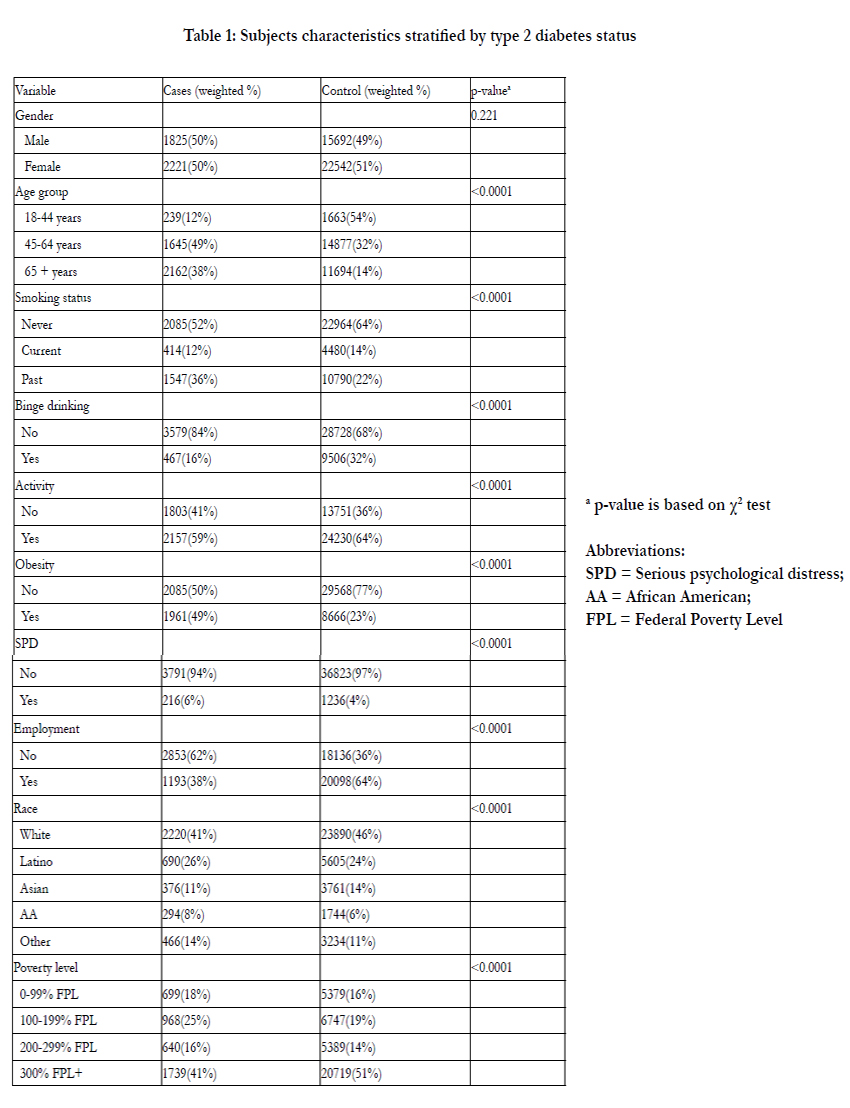

Table 1: Subjects characteristics stratified by type 2 diabetes status.
ap-value is based on χ2 test Abbreviations:
SPD = Serious psychological distress;
AA = African American;
FPL = Federal Poverty Level
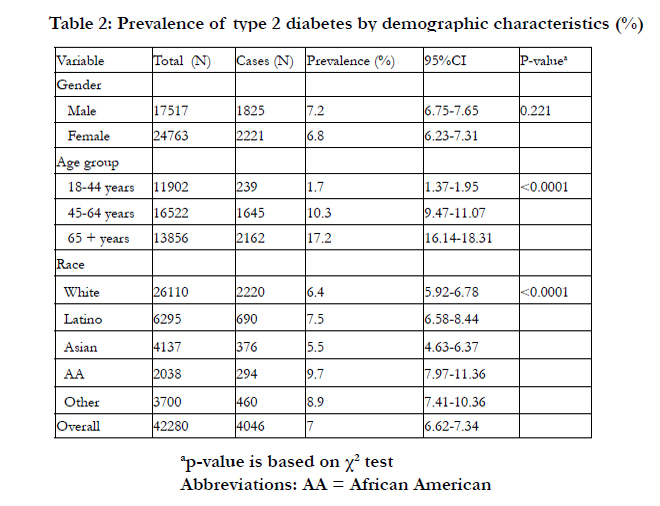
Table 2: Prevalence of type 2 diabetes by demographic characteristics (%).
ap-value is based on χ2 test
Abbreviations: AA = African American
The results of univariate and multiple logistic regression analyses are presented in Table 3. By using univariate analysis, all factors except for gender were associated with T2D (P < 0.05). Multiple logistic regression analyses showed that past smoking (OR = 1.28, 95% CI = 1.13-1.45), middle-aged adults (OR = 6.23, 95% CI = 5.09-7.62) and elderly adults (OR = 10.38, 95% CI = 8.28-13.0), obesity (OR = 3.19, 95% CI = 2.82-3.61), and poor poverty were positively associated with T2D. Latinos (OR = 1.81, 95% CI = 1.52-2.16), Asians (OR = 1.58, 95% CI = 1.30-1.91), AAs (OR = 1.52, 95% CI = 1.20-1.92) were more likely to have T2D compared to Whites. Furthermore, being female (OR = 0.76, 95% CI = 0.67-0.86), and employment (OR = 0.56, 95% CI = 0.49-0.64) were associated with a reduced risk of having T2D. There was a strong inverse association between binge drinking and T2D (OR = 0.67, 95% CI = 0.57-0.80).
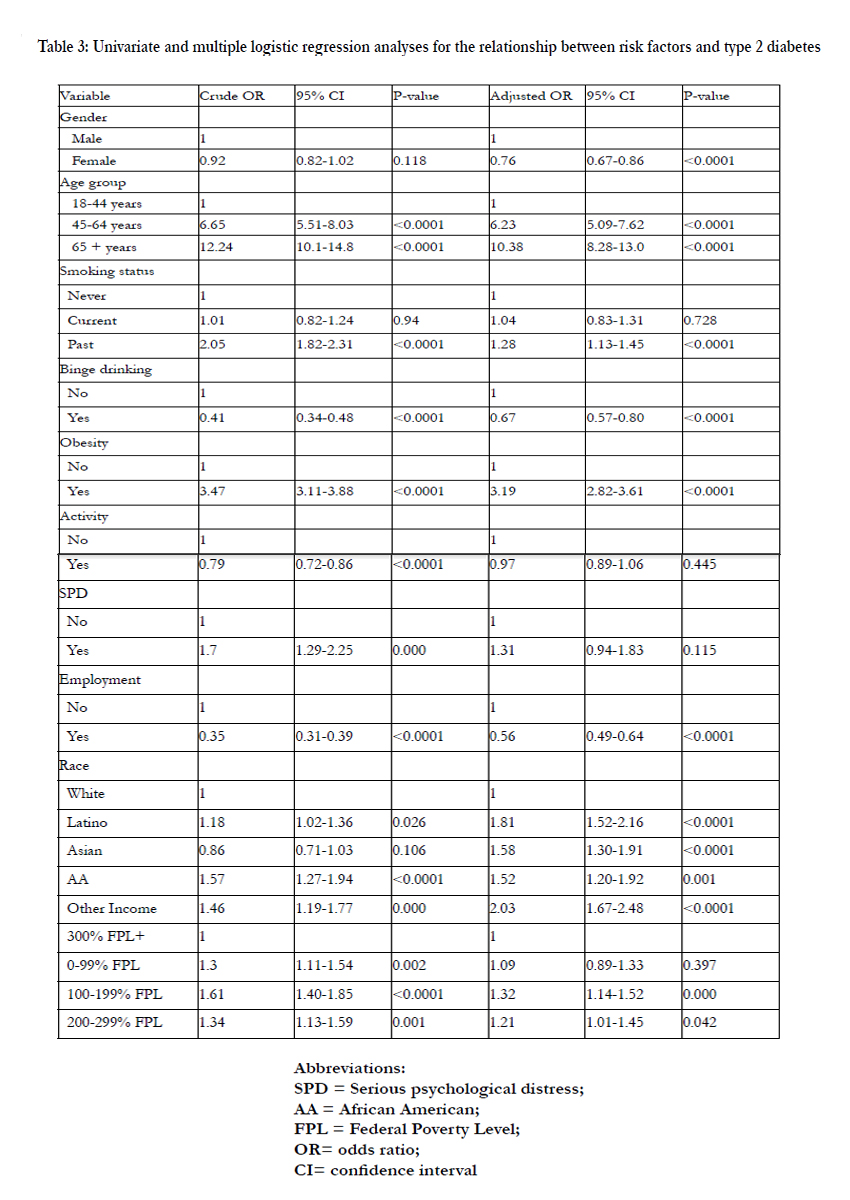
Table 3: Univariate and multiple logistic regression analyses for the relationship between risk factors and type 2 diabetes.
Abbreviations:
SPD = Serious psychological distress;
AA = African American;
FPL = Federal Poverty Level;
OR= odds ratio;
CI= confidence interval
Table 4 shows the impact of smoking, binge drinking, and obesity on T2D by age and race. Obesity was positively associated with T2D in all age and race groups. Past smoking was positively associated with T2D just in middle-aged Asians (OR = 2.00, 95% CI = 1.07-3.74) and Whites (OR = 1.47, 95% CI = 1.14-1.91). Binge drinking was negatively associated with T2D in middle-aged and elderly Whites (OR = 0.61, 95% CI = 0.45-0.83; OR = 0.60, 95% CI = 0.41-0.87, respectively) as well as in elderly Asians (OR = 0.33, 95% CI = 0.14-0.78).
Table 4: Multiple logistic regression analyses for the relationship between risk factors and type 2 diabetes by gender and race
Race 1 = Latino,
2 = Asian,
3= African American (AA),
4= White Abbreviations: OR= odds ratio; CI= confidence interval
Discussion
Using a large survey in the California in the US, we found that past smoking, older age, nonwhite (Latinos, Asians, and AAs), obesity and poverty were positively associated with T2D. Furthermore, being female, binge drinking and employment were negatively associated with T2D. Stratified by age and race, obesity was positively associated with T2D in all age and race groups. Past smoking was positively associated with T2D just in middle-aged Asians and Whites. Binge drinking showed negative association with T2D in middle-aged and elderly Whites as well as in elder Asians.
The overall prevalence of T2D in the California was 7.0%, which is a little lower than the national prevalence (7.7%) based on the 2003-2004 NHANES [3] but similar to the national rate (6.8%) based on 1999-2004 NHANES [4]. Furthermore, we found that the prevalence in Whites (6.4%) was higher than Asians (5.5%) but lower than Latinos (7.5%) and AAs (9.7%). The prevalence in whites is a little higher than previously reported value (5.9%) while the prevalence in Asian is lower than those (8.1%, 7.1%,7.0%, 6.3%, and 5.9% for Filipinos, Japanese, Vietnamese, Koreans and Chinese, respectively) using CHIS 2007 data [18]. The prevalence of T2D in AAs (9.7%) was closed to the national prevalence (10.2%) using the NHIS 1997-2005 data [19] and was a little lower than the value (11%) using NHANES 4 data [4]. The prevalence in Latinos (7.5%) was lower than that in Puerto Ricans (11.0%), Mexican Americans (10.2%) but was higher than that in Mexicans (6.2%), Dominicans (5.2%), and Central and South Americans (4.0%) [19].
An inverse association between binge drinking and T2D was observed among all participants. The Nord -Trondelag Health Study explained the association into the improvement in insulin sensitivity which was explained by an insulin resistance research from Wilkin [20,21]. Binge drinking and high alcohol consumption may increase the risk of T2D [22] or just increase the risk in women [23]. Another study showed that total alcohol consumption and binge drinking increased the risk of pre-diabetes and T2D in men, while low consumption decreased T2D risk in women [24]. A recent study showed that moderate alcohol consumption was associated with a reduced risk of T2D in men, but not in women; no increased risk was seen in participants who reported to have binge drinking or were problem drinkers [20]. Several studies also indicated different associations for both sexes [23-25]. Stratified analysis of our research confirmed the inverse association in middle- aged and elder Whites as well as in elderly Asians. However, a non-significant association with T2D was found in Latinos, AAs, and middle-aged Asians.
As consistent with a previous study [26], past smoking was a risk factor of T2D. The increased risk may be partially explained by weight gain [26,27]. Researches also detected that the risk would peak within three years after quitting smoking [26]. However, our study revealed that past smoking was positively associated with T2D just in middle-aged Asians and Whites. No significant association of pasting smoking with T2D was found in elder group in all races, and middle-aged Latinos and AAs.
Some limitations of the current study should be noticed. First,subjects without phones, or did not respond to the calling were excluded from the survey. In addition, institutionalized people who were homeless or lived in group homes, nursing home, or prisons were excluded. The number of elderly and the risk factors of T2D in this age may be underestimated due to the exclusion. Second, self-report measures may be subject to recall bias. Finally, the cross-sectional study cannot determine the causal relationships between these factors and T2D risk. However, the current study provides preliminary results for the variation of risk factors of T2D in different racial groups using a large sample. Worldwide, the incidence of T2D is rising rapidly. Globally, there were 366 million people with diabetes in 2011, and the number is expected to rise to 552 million by 2030 [28]. The detection of risk factors of T2D particularly of whether there being age and race differences in such factors is important for the invention of T2D in public health implication.
Conclusion
Lifestyle factors (binge drinking and smoking) were associated with T2D. The association varied by age and race. The findings of risk factors of T2D particularly of whether there being and race differences in these factors may provide an important guild for T2D intervention.
Acknowledgements
The authors would like to thank the support of Data from the 2011-2012 California Health Interview Survey.
References
- Gonzalez EL, Johansson S, Wallander MA, Rodríguez LA(2009) Trends in the prevalence and incidence of diabetes in the UK: 1996-2005. J Epidemiol Community Health; 63(4): 332-336.
- IDF. IDF Diabetes Atlas, 4th edn. International Diabetes Federation, Brussels, 2009.
- Navas-Acien A, Silbergeld EK, Pastor-Barriuso R, Guallar E(2008). Arsenic exposure and prevalence of type 2 diabetes in US adults. JAMA; 300(7):814- 22.
- Zhang Q, Wang Y, Huang ES(2009). Changes in racial/ethnic disparities in the prevalence of Type 2 diabetes by obesity level among US adults. Ethn Health;14(5):439-57
- Zhang P, Zhang X, Brown J, Vistisen D, Sicree R, et al. (2010) Global healthcare expenditure on diabetes for 2010 and 2030. Diabetes Res Clin Pract; 87(3): 293-301.
- Centers for Disease Control and Prevention, 2011. Centers for Disease Control and Prevention. National Diabetes Fact Sheet: National Estimates and General Information on Diabetes and Prediabetes in the United States (2011), pp. 2–3.
- Bi Y, Wang T, Xu M, Xu Y, Li M, et al.(2012) Advanced research on risk factors of type 2 diabetes. Diabetes Metab Res Rev; 28 Suppl 2:32-9.
- Glauber H, Karnieli E(2013). Preventing type 2 diabetes mellitus: a call for personalized intervention. Perm J Summer;17(3):74-9.
- Schellenberg ES, Dryden DM, Vandermeer B, Ha C, Korownyk C(2013) Lifestyle interventions for patients with and at risk for type 2 diabetes: a systematic review and meta-analysis. Ann Intern Med;159(8):543-51.
- Beziaud F, Halimi JM, Lecomte P, Vol S, Tichet J(2004). Cigarette smoking and diabetes mellitus. Diabetes Metab;30(2):161-6.
- Clair C, Meigs JB, Rigotti NA(2013). Smoking behavior among US adults with diabetes or impaired fasting glucose. Am J Med. Jun;126(6):541.e15-8.
- van Dam RM(2003). The epidemiology of lifestyle and risk for type 2 diabetes. Eur J Epidemiol.;18(12):1115-25.
- California Health Interview Survey (2013). CHIS 2011-2012 Adult Survey. UCLA Center for Health Policy Research. Los Angeles, CA: August.
- Kessler RC, Andrews G, Colpe LJ, Hiripi E, Mroczek DK (2002) Shortscreening scales to monitor population prevalences and trends in non-specific psychological distress. Psychol Med; 32: 959–76.
- Kessler RCP, Barker PRM, Colpe LJP, Colpe LJ, Epstein JF, et al. (2003) Screening for serious mental illness in the general population. Arch Gen Psychiatry; 60: 184–9.
- Kessler RC, Berglund P, Demler O, Jin R, Merikangas KR, et al. (2005) Lifetime prevalence and age-of-onset distributions of DSM-IV disorders in the National Comorbidity Survey Replication. Arch Gen Psychiatry; 62: 593-602.
- Kessler RC, Green JG, Gruber MJ, Sampson NA, Bromet E, et al.(2010) Screening for serious mental illness in the general population with the K6 screening scale: results from the WHO World Mental Health (WMH) survey initiative. Int J Methods Psychiatr Res; 19 Suppl 1: 4-22.
- Choi SE, Chow VH, Chung SJ, Wong ND (2011). Do risk factors explain the increased prevalence of type 2 diabetes among California Asian adults? J Immigr Minor Health;13(5):803-8
- Borrell LN, Crawford ND, Dallo FJ, Baquero MC (2009). Self-reported diabetes in Hispanic subgroup, non-Hispanic black, and non-Hispanic white populations: National Health Interview Survey, 1997-2005. Public Health Rep;124(5):702-10.
- Rasouli B, Ahlbom A, Andersson T, Grill V, Midthjell K, et al.(2013) Alcohol consumption is associated with reduced risk of Type 2 diabetes and autoimmune diabetes in adults: results from the Nord-Trondelag health study.Diabetic Medicine; 30(1): 56-64.
- Wilkin TJ (2009). The accelerator hypothesis: a review of the evidence for insulin resistance as the basis for type I as well as type II diabetes. International Journal of Obesity; 33(7): 716-726.
- Pietraszek A, Gregersen S, Hermansen K (2010). Alcohol and type 2 diabetes. A review. Nutr Metab Cardiovasc Dis;20(5):366-75.
- Carlsson S, Hammar N, Grill V, Kaprio J (2003). Alcohol consumption and the incidence of type 2 diabetes: a 20-year follow-up of the Finnish twin cohort study. Diabetes Care; 26(10):2785-90.
- Cullmann M, Hilding A, Östenson CG (2012). Alcohol consumption and risk of pre-diabetes and type 2 diabetes development in a Swedish population. Diabet Med; 29(4):441-52.
- Conigrave KM, Hu BF, Camargo CA Jr, Stampfer MJ, Willett WC, et al.( 2001) A prospective study of drinking patterns in relation to risk of type 2 diabetes among men. Diabetes; 50(10): 2390-2395.
- Yeh HC, Duncan BB, Schmidt MI, Wang NY, Brancati FL (2010). Smoking, Smoking Cessation, and Risk for Type 2 Diabetes Mellitus A Cohort Study. Annals of Internal Medicine; 152(1): 10-7.
- Duncan BB, Schmidt MI, Pankow JS, Ballantyne CM, Couper D, et al.(2003) Low-grade systemic inflammation and the development of type 2 diabetes mellitus - The ARIC study. Diabetes; 52: A58-A58.
- Whiting DR, Guariguata L, Weil C, Shaw J (2011). IDF diabetes atlas: global estimates of the prevalence of diabetes for 2011 and 2030. Diabetes Res Clin Pract; 94(3): 311-321.