Neural Networks for Predicting the Wear Properties of Sintered Ti-6Al-4V Composite Reinforced with Nano B4C Particle and Classification using Data Mining Tools
P Radha1*, N Selvakumar2
1 Associate Professor, Department of Computer Applications, Mepco Schlenk Engineering College, Sivakasi, Tamilnadu, India.
2 Senior Professor, Department of Mechanical Engineering, Mepco Schlenk Engineering College, Sivakasi, Tamilnadu, India.
*Corresponding Author
P. Radha,
Associate Professor,
Department of Computer Applications,
Mepco Schlenk Engineering College,
Sivakasi - 626 005, Tamilnadu, India
Tel: 04562 235453
Fax: 04562 235111
E-mail: csnam@ncsu.edu
Received: October 17, 2016; Accepted: December 12, 2016; Published: December 14, 2016
Citation: P Radha, N Selvakumar (2016) Neural Networks for Predicting the Wear Properties of Sintered Ti-6Al-4V Composite Reinforced with Nano B4C Particle and Classification using Data Mining Tools. Int J Comput Neural Eng. 3(3), 40-48. doi: dx.doi.org/10.19070/2572-7389-160006
Copyright: P Radha© 2016. This is an open-access article distributed under the terms of the Creative Commons Attribution License, which permits unrestricted use, distribution and reproduction in any medium, provided the original author and source are credited.
Abstract
This proposed work is to improve the strength and wear resistance of materials by reinforcing the composite preform (Ti-6Al-4V) with an addition of (2-10) wt. % of nano boron carbide particles. The characterization was performed through Scanning electron microscope of above composites. While measuring wear using pin-on-disk testing machine, the temperature, load, sliding distance are varied for identifying the nature of dry and high temperature wear of prepared composite. The output of this wear experimental work is fed to the soft computing based tool like Artificial Neural Network for predicting the wear properties such as specific wear rate and coefficient of friction. Further, with respect to the temperature and B4C%, the wear properties are analysed using data mining tool like Decision Tree. Moreover, fixing the range of metal powders for classifying the wear properties of composite preforms can be automated by using Fuzzy logic.
2.Introduction
3.Experimental Details
3.1.Wear properties
4.Developing Soft Computing Based Models
4.1.Using prediction tool
4.2.Data mining tool for categorization
5. Results and Discussion
5.1.ANN approach to predict the properties of dry wear
5.2.Characterizing wear properties by constructing Decision Tree
5.3.Fixing range of parameters using Fuzzy as fixing tool
6.Conclusion
7. References
Keywords
Dry and High Temperature Wear; Ti-6Al-4V; Boron Carbide; Neural Networks; Fuzzy Approach; Data Mining..
Introduction
Titanium matrix composites (TMC) are good-looking materials for structural application in aircraft, automobile and military industries. TMC has high strength to weight ratio and good wear resistance. These have stimulated further research to grow their applications, by additional enhancement in the properties. Ti-6Al- 4V (Grade 5) is one of the supreme extensively used titanium alloys, because of its high specific strength and good corrosion resistance. However, the foremost disadvantages of titanium and its alloys are low hardness and poor resistance to sliding wear [1-3]. Ceramic particles such as W, TiC, Al2O3 and Boron carbide (B4C) are mostly used for reinforcement of TMC. B4C is one of the supreme promising ceramic materials due to its good properties, such as high strength, low density, extreme high hardness and good chemical stability [4-6]. Many techniques have been used for the fabrication of Ti-6Al-4V-B4C composites such as liquid phase methods and solid-state consolidation [7-10]. However, due to its poor wetting between Ti-Al-V and B4C, liquid phase method is difficult. Powder metallurgy (P/M) processing is an alternative method to fabricate of Ti-6Al-4V-B4C composites. Moreover in this process, the problem of non-wettability of B4C with molten TMC does not arise. Mechanical alloying is a good-looking P/M technique that produces uniform dispersion of the secondary particles in the matrix.
By considering the above advantages, the P/M Lab uses composites preform (Ti-6Al-4V) with an addition of (2-10) wt. % of nano B4C using mechanical alloying method to improve the strength of materials. This strategy mixes the metal powders such as Ti, Al and V with B4C to avoid the dimension loss of composites due to friction and heat. While measuring the dry and high temperature wear using pin-on-disk testing machine, the temperature, load, sliding distance are varied for identifying the wear resistance of the prepared composites.
Soft Computing models have been studied in recent years, with an objective of achieving human like performance in many fields of knowledge engineering. Many researchers have attempted to use soft computing tools like Artificial Neural Network (ANN), Fuzzy Logic (FL) and Genetic Algorithm (GA) for material design, controlling materials fabrication and simplifying the various processes involved in the manufacturing section of P/M Lab [11]. ANN is used to predict the wear properties of dry and high temperature conditions of nano composites without conducting experiments in P/M Lab for the wide range of tests. The data mining tool like Decision tree can act as a reduction tool to select the most prominent parameters in the data classification [12]. Hence the decision tree is constructed from the output of neural network to characterize the wear properties with respect to dry wear and high temperature wear. Fuzzy logic provides a powerful computational paradigm for the better representation of knowledge in materials engineering [13]. The application of FL will be helpful in P/M Lab for classifying the properties of nano composites into various levels like low, medium and high level. The knowledge of this classification will be useful for the technicians working in the laboratory to fix the range of input parameters while mixing various metal powders for preparing composites.
Experimental Details
Ti-6Al-4V-(2-10) wt. % of nano B4C composite sintered preforms were selected in order to deliver a sensibly wide range of study namely dry and high temperature wear. These powders were obtained from M/s. Alfa Aesar, United States and M/s. Sigma Aldrich, Germany having particle size of ≤ 44 μm.
These powders were individually milled in planetary ball mill for different milling time with tungsten carbide vial using 10 mm diameter tungsten carbide balls. The ball to powder ratio was taken as 20:1. The milling speed was set at 300 rpm and the powders were milled under wet medium and inert gas atmosphere condition to avoid oxidation. Ti, Al, V particles were reduced to ≤ 500 nm and B4C can be further reduced to ≤ 100 nm. Figure. 1 (a-d) shows the SEM image of Ti, Al, V and B4C powders after milling. Further the individual powders were blended in a planetary ball mill for 1 h to get uniform distribution of reinforcement particles to prepare the composite powders. The homogenous distribution of the composite powders was evaluated using SEM and it shows in Figure 2 (a-b).
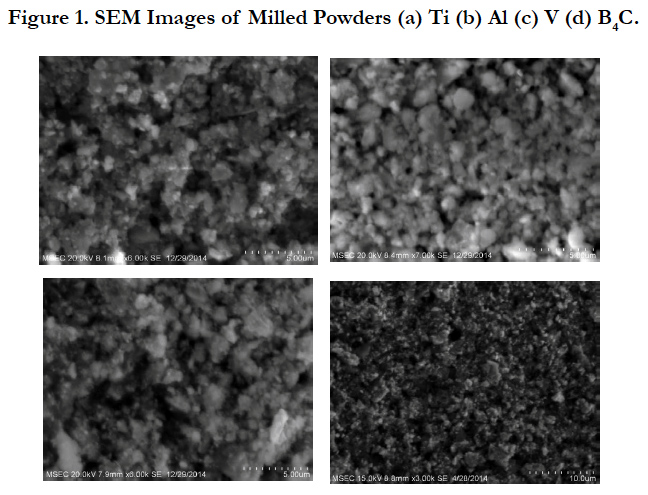
Figure 1. SEM Images of Milled Powders (a) Ti (b) Al (c) V (d) B4C.
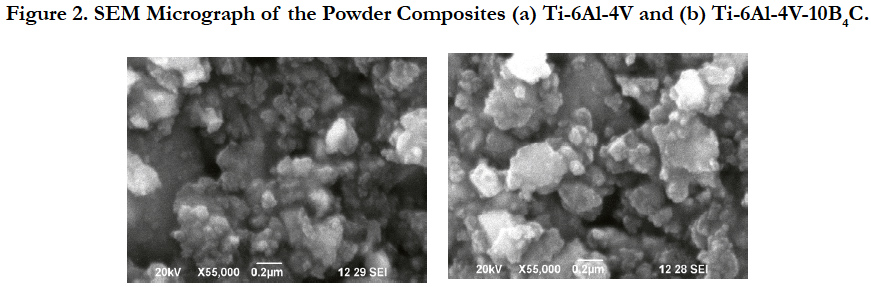
Figure 2. SEM Micrograph of the Powder Composites (a) Ti-6Al-4V and (b) Ti-6Al-4V-10B4C.
The mixed powders were compacted in a compression testing machine by closed die set assembly technique for 10 mm diameter specimen. The MoS2 was applied at inner surfaces of the die and outer surfaces of the punch for the easy ejection of the specimen. Further the green compacts were sintered in a muffle furnace at a temperature of 900°C for a holding time of one hour. To avoid oxidation the green compacts were sintered in an inert atmosphere and the preforms were furnace cooled till the room temperature has obtained.
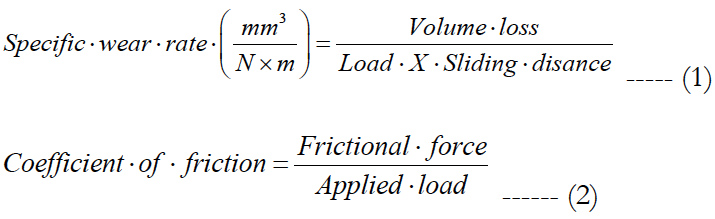
Dry and high temperature wear tests were conducted by using pin on disk wear testing machine (DUCOM, Bangalore Type: TR- 20LE-PHM-400). The preforms were in cylindrical form with 10 mm diameter and 30 mm height. The surfaces were polished by various grit/emery papers before conducting the experiments. While conducting the high temperature wear test, the pin was heated uniformly using a heater assembly in the wear tester. Two experimental conditions of load and sliding distances were selected and varied at constant velocity. Five different loads were selected such as 10 N, 15 N, and 20 N, 25 N and 30 N and four different sliding distances such as 1000 m, 1400 m, 1800 m and 2200 m with constant velocity of 3.14 m/s. After wear testing, the specimens were cleaned with acetone and weighted using electronic digital balance machine with an accuracy of ± 0.001 mg. The specific wear rate (SWR) was calculated by using weight loss method and the empirical relationship is shown in Eq. (1). During the wear testing the friction force is calculated by the wear testing machine and the frictional force is converted into coefficient of friction (CoF) by using Eq. (2).
The raw data of the collected samples for the computational analysis is shown in Table 1.
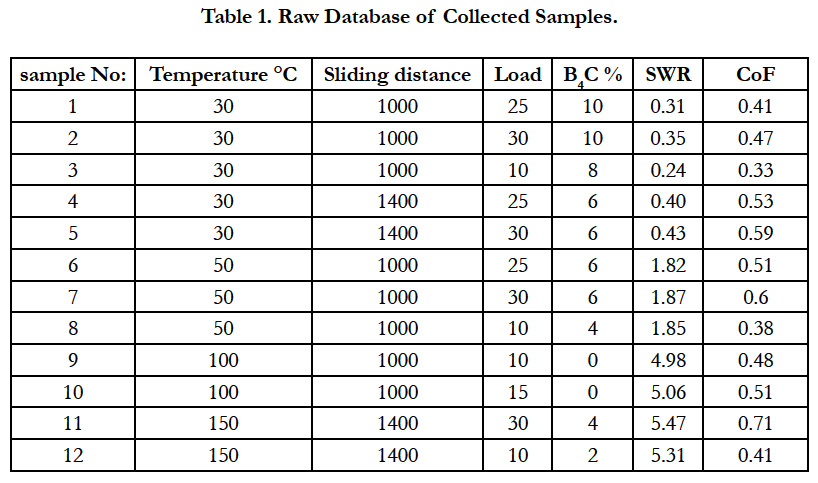

Table 1. Raw Database of Collected Samples.
Developing Soft Computing Based Models
The experiments conducted physically in P/M Lab as given in Sec.2, need costly equipment’s. In order to provide further simplified computational analysis, the proposed work can be implemented by the soft-computing tools like ANN & FL.
A fundamental aspect of Neural Networks (NN) is to use easy processing elements that are mainly models of neurons with in the brain. These neurons are then connected along during a well ordered fashion, though the strength of the connecting links read out the overall operational characteristics for the entire network. Neural networks operate by simulating the ability of biological neural systems to perform complicated tasks without any prior programming. In general, NN are a mathematical techniques designed to bring about a variety of tasks. NN uses a collection of processing nodes loosely analogues to neurons within the brain. These nodes are consistent in a network that can identify patterns in data as it is exposed to the data. NN can be configured in various arrangements to perform a range of tasks including classification, data mining, pattern recognition and process modelling [14]. The proposed work uses Back Propagation Network (BPN) model to predict the wear properties. It is a feed-forward network consisting of three layers namely input, hidden and output layer .ANN has two stages namely training and testing. During training, network is trained with sufficient training samples with desired output. While testing, the ANN is able to recognize both dependent samples (part of training samples) and independent samples (not a part of training samples) to predict the output data. The BPN applies the algorithm as given below to learn the given environment.
The BPN applies the algorithm as given below to learn the given environment.
i) Select the next pattern Xi from the training set and present it in to the network.
ii) Compute activations signals of input, hidden and output neurons in that sequence as given below in the forward phase:
Let n, p, z are the size of input layer, output layer and hidden layer respectively.
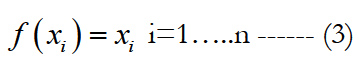
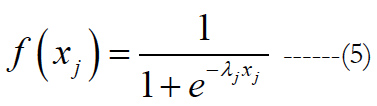
For input layer: Calculate activation function value as per Eqn. (3)
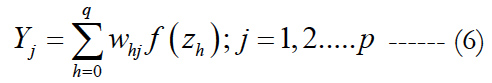
For Hidden layer: Calculate net output by
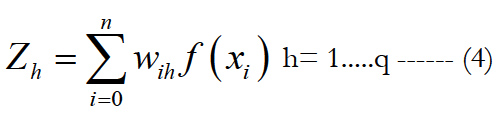
and calculate activation function value as per Eqn. (5)
For output layer: Calculate net output by
and calculate activation function value as per Eqn.(3).
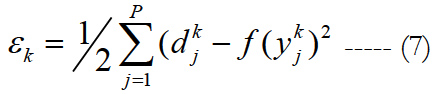
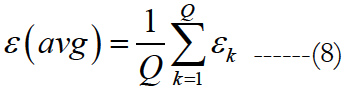
iii) Compute the instantaneous error over the output neurons by comparing the generated outputs with the desired outputs as per Eqn. (7).
and compute mean error by Eqn. (8).
iv) Use the error calculated in step (iii), in backward phase; compute the change in the hidden to output layer weights, and the change in input to hidden layer weights, such that a global error measure gets reduced. Error gradient term is derived between output to hidden layer.
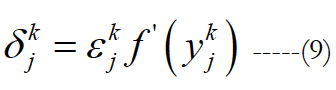
where f' (ykj) is partial derivative of actual output of network.
Compute error gradient term between hidden layer to input layer.
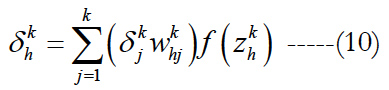
where f' (zkh) is the partial derivative of output of hidden layer.
v) Update all weights of the network in accordance with the changes computed in step as defined in Eqns. (11) and (12).
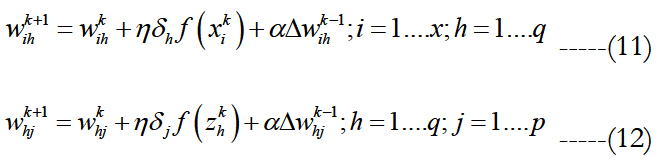
where η is the momentum and δ is the learning parameter.
vi) Repeat steps (i) through (v) until the global error falls below a predefined threshold. The network training may be stopped with respect to the maximum training time or epochs or the tolerance reached. Then the trained network was tested using the steps (i) and (ii).
Decision tree is a flow-chart like tree structure, where each internal node denotes a test on a parameter, each branch represents the outcome of the test and the leaf nodes represent classes. The top most nodes are called as root node and the paths from root to leaf represents the classification rules. Decision trees classify given data samples by starting at the root of the tree and moving through it until a leaf node. The decision tree is constructed to classify the data as per the following algorithm.
Algorithm:
Step 1: Tree starts as a single node representing all the samples of data.
Step 2: If the samples are all of the same class, then the node becomes a leaf and is labeled with that class.
Step 3: Otherwise computer heuristic measure for selecting the parameter that will best separate the samples into individual classes. This parameter is the test parameter at that node.
Step 4: Branch is created for each known value of test parameter and data samples are portioned accordingly,
Step 5: The above steps are repeated called recursively to the decision tree for the data samples at each partition.
Step 6: The recursive portioning stops only when any one of the following condition is true.
i). All samples for a given node belong to the same class.
ii). There are no remaining parameters on which the samples may be further partitioned.
iii). There are no data samples for the branch of test parameter. In this case, a leaf node is created with the majority class in data samples.
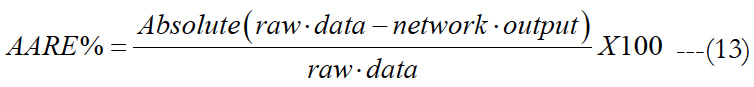
The equation (1) uses load, sliding distance and volume loss as input variable to compute the CoF. The volume is a previously computed value to derive the CoF using hard computing approach. Since neural network is a best tool to find the non-linear mapping between input and output, without applying specific parameters explicitly to the BPN. Hence in this work, a simple neural network model was carried out by using temperature, sliding distance, weight percentage of nano B4C and load as inputs and the forecasted parameters specific wear rate and coefficient of friction as output parameters. Based on the criticality of the data, the size of input, output and hidden layers of BPN are selected as 4, 2 and 12 respectively. Among the experiment samples collected from P/M Lab, 400 samples were chosen for training, 80 samples were applied for testing. The learning parameter δ was initialized as 0.4 and momentum η as 0.9. The network was trained upto 500 epochs and tested. The deviation between the expected and actual network output was measured in terms of correlation coefficient (R) and the results for CoF and SWR were shown in Figure 3 (a-b). Even though the Correlation coefficient value is good, it is not applicable practically to find the relation between two parameters. The AARE% (Average Absolute Relative Error) is used mostly by the researcher [11] as given in Eqn. (13), since it is an unbiased term to measure the error accurately. The AARE% for the predictability of SWR was measured as 0.989290 and CoF as 3.282888. The comparison between the raw data and the predicted values of SWR and CoF are shown in Figure 4 and Figure 5 respectively.
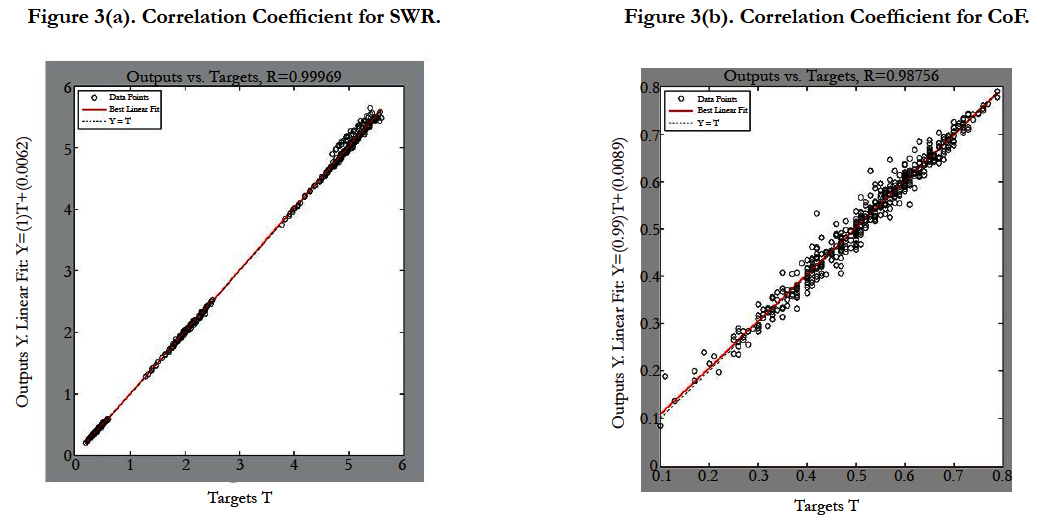
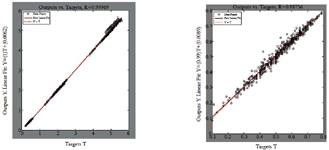
Figure 3(a). Correlation Coefficient for SWR.
Figure 3(b). Correlation Coefficient for CoF.
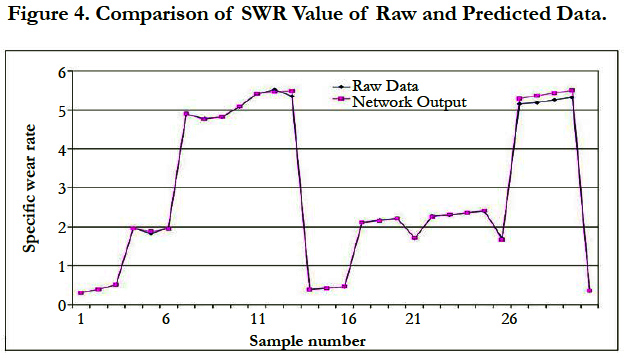
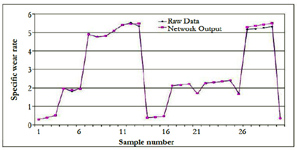
Figure 4. Comparison of SWR Value of Raw and Predicted Data.
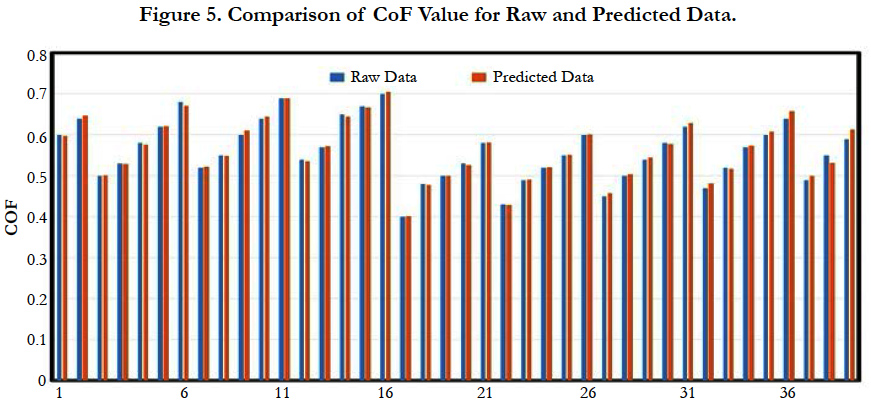
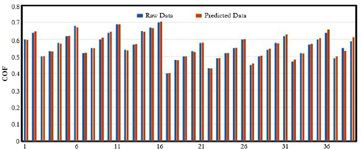
Figure 5. Comparison of CoF Value for Raw and Predicted Data.
The results of partial samples are given Table 2. The above analysis proved that the BPN is able to identify the non-linear relationship exists among the parameters of powders and predict the wear characteristics of output parameters.
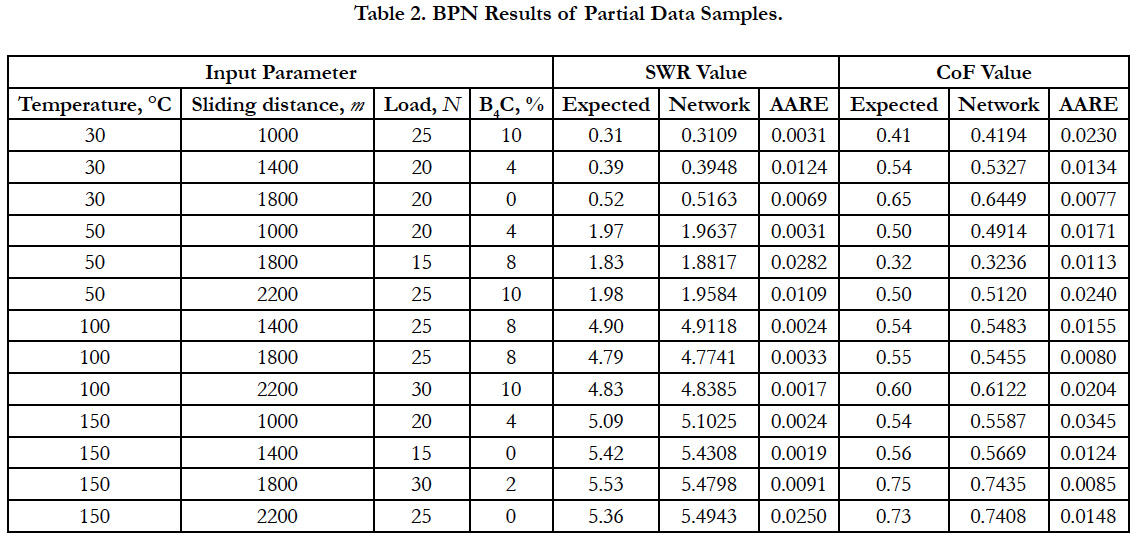
Table 2. BPN Results of Partial Data Samples.
The output of BPN is given to the construction of Decision Tree for analysing the nature of parameters involved in the preparation of composite preforms. Based on this model, the wear properties are categorized as two major classes like dry wear and high temperature wear. The right branch at each node explores the possibility of more wear values while left branch exposes the lesser values. The tree starts at root node with temperature less than 75°C at left branch (to explore dry wear) and temperature greater than 75°C at right branch (to explore high temperature wear). In the next level, it explores the similar possibilities with temperature less than 40°C at left sub branch and temperature greater than 40°C at right sub branch. Finally in the leaf node level, the wear properties are analysed. Figure 6(a-b) explores the decision trees to analyze CoF and SWR respectively. For example at room temperature 30°C (less than 40°C) at the leftmost sub tree of Figure 6(a), SWR value is 0.39475 which will reflect the nature of hard material. The soft material is characterized at the right most sub branch for the SWR value 5.1044 with temperature greater than 125°C.

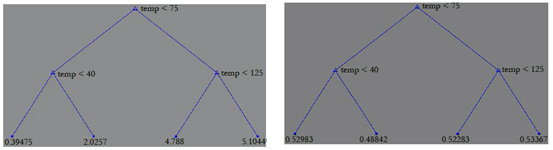
Figure 6. Decision Tree Analysis using Temperature for varying (a) SWR (b) CoF.
Figure 7(a-b) reflects the contribution of B4C% in the preparation soft and hard materials. The B4C% at root node explores the possibilities such as less than 5% or not. The internal nodes are explored with the testing conditions for 1%, 3%, 7% and 9%. At leaf node level, the leftmost branch predicts 3.3101 as SWR value in the less than 1% contribution of B4C (in case of dry wear). The SWR value is 2.8221 at the rightmost leaf node of Figure 7(a) for the contribution of B4C% which is greater than 9% (in case of high temperature wear). Figure 8 shows the Contribution of temperature and B4C in SWR Analysis. The material hardness properties are known while moving towards left sub branch and the contribution of temperature and B4C % in the prediction material softness in the right branch.
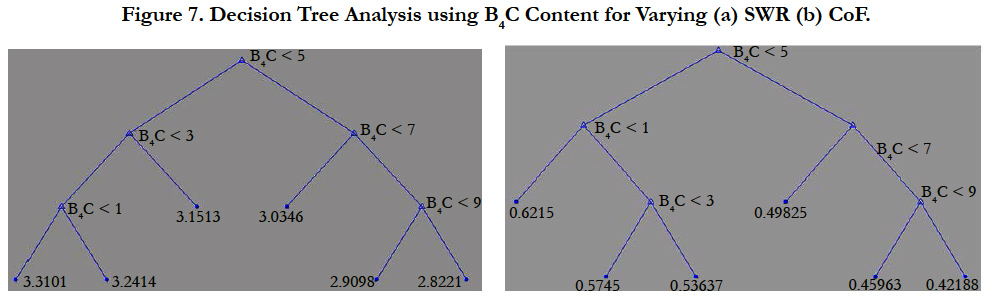
Figure 7. Decision Tree Analysis using B4C Content for Varying (a) SWR (b) CoF.
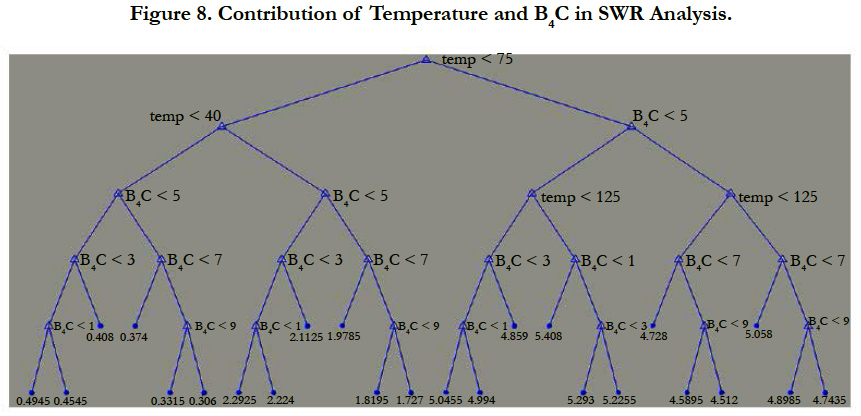
Figure 8. Contribution of Temperature and B4C in SWR Analysis.
Both at left sub tree (dry wear case) and right sub tree (high temperature wear case), the wear properties are inferred at the leaf nodes in the order of hard materials towards soft material by the contribution of B4C %. This kind of analysis will be helpful to decide the proportionalities of input parameters of metal powders in categorizing nature of materials with respect to dry wear and high temperature wear.
The fuzzy logic can model the non-linear functions of absolute complexness. Fuzzy logic offers approximation solution whereas neural network gives precise solutions. The fuzzy inference system with interrelated variables is used to enhance reasoning in classifying the wear properties of composites. This system adapts major four input variables, namely temperature, sliding distance, load and B4C and two output parameters viz. SWR and CoF. As per the input given, it will classify the properties of composites.
The input parameters Temperature, sliding distance, load and B4C use triangular-shaped membership function. The triangular curve is a function of a vector, x, and depends on three scalar parameters a, b, and c as given below.
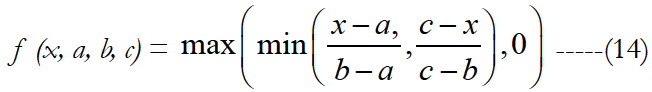
The parameters a and c locate the "feet" of the triangle and the parameter b locates the peak.
1. Temperature: The minimum and maximum values for temperature are 30°C and 150°C respectively in the collected raw data. The membership value is categorized into low, medium and igh levels as given below:
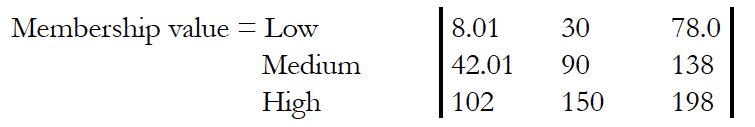
2. Sliding distance: The minimum and maximum values for Sliding distance are 1000 m and 2200 m respectively in the collected raw data. The membership value is categorized into low, medium and high levels as given below:

Load: The minimum and maximum values for load are 10 N and 30 N respectively in the collected raw data. The membership value is categorized into low, medium and high levels as given below:
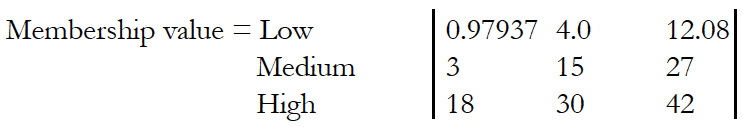
B4C: The minimum and maximum values for B4C are 0% and 10% respectively in the collected raw data. The membership value is categorized into low, medium and high levels as given below:
Two output parameters of Fuzzy Inference System (FIS) use the trapezoidal function whose curve is a function of a vector, x, and depends on four scalar parameters a, b, c, and d, as given by:
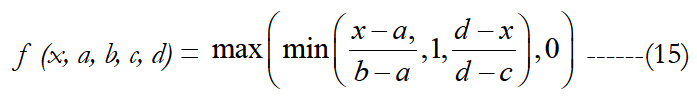
The parameters a and d locate the "feet" of the trapezoid and the parameters b and c locate the "shoulders."
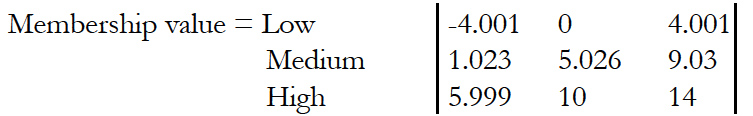
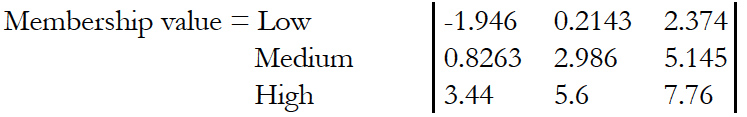
CoF: The minimum and maximum values for CoF are 0.2 and 5.6 respectively in the collected raw data. The membership value is categorized into low, medium and high levels as given below:
SWR: The minimum and maximum values for SWR are 0.2 and 0.79 respectively in the collected raw data. The membership value is categorized into low, medium and high levels as given below:
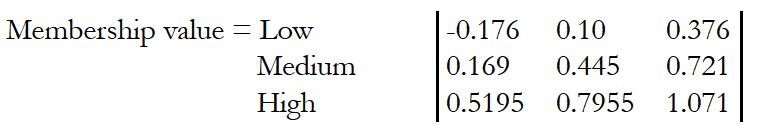
Table 3 shows the classification of wear properties into low level, medium level and high level with respect to the contribution of input parameters of metal powders [15].
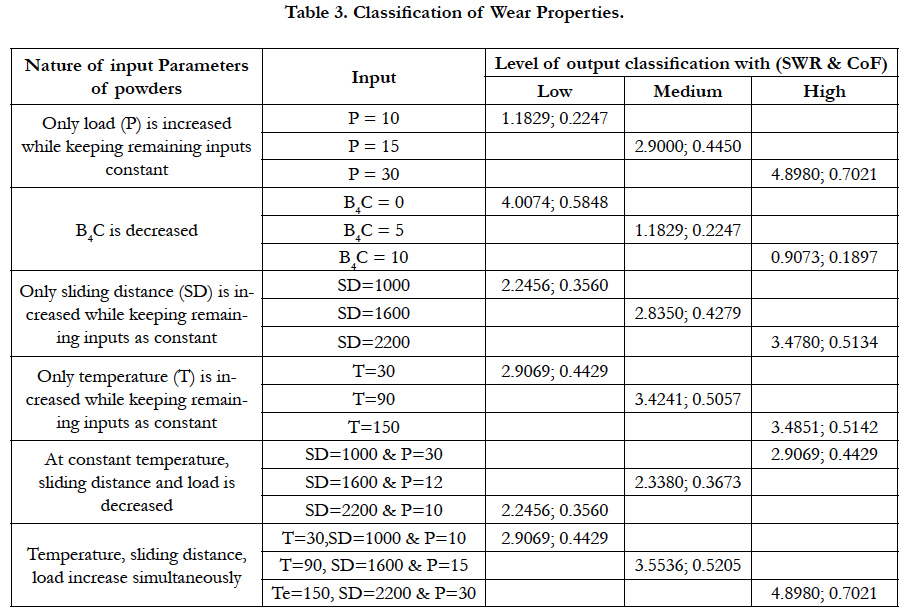
Table 3. Classification of Wear Properties.
From the above analysis, it proves that the temperature should be in between 8 °C and 78°C, sliding distance is to be in between 520.1 m – 1480 m and load in between 0.97937 N and 12.08 N to classify as low level properties of preforms. The temperature should be 42.01°C - 138°C, sliding distance between 1120 m and 2080 m and load between 3 and 27 to classify the medium level. To classify higher level wear properties of composite preforms, the temperature must in the range 102°C - 198°C, sliding distance must be 1720 m - 2680 m and load must be in the range of 18 N – 42 N. Addition of B4C value in the range -4.001% to 4.001%, 1.023% to 59.03% and 5.999% to 14% respectively to classify the wear properties as high, medium and low.
Conclusion
Thus the soft computing based model was developed to improve the strength of materials in P/M lab by analysing wear properties of composite preform (Ti-6Al-4V) with an addition of (2-10) wt. % of nano boron carbide (B4C) particles.
• The prediction model tool like BPN has applied to predict the wear properties like SWR and CoF using the input parameters like temperature, sliding distance, load, B4C in case of dry wear.
• This BPN model was redesigned with temperature to predict the properties of high temperature wear. The predictability of these models was measured during testing as 0.98929% and 0.982957% for the CoF value of dry and high temperature wear properties of composite respectively.
• The output parameter SWR was predicted as 3.282888 % and 1.011628% in case of dry and high temperature wear properties of composite respectively.
• The individual and combined contribution of B4C% and temperature proved using decision trees in deciding the proportionalities of input parameters of metal powders for categorizing nature of materials with respect to dry wear and high temperature wear.
• This approach applied fuzzy logic as fixing tool to analyze the range of input parameters for preparing the composite Ti-6Al-4V. It was observed that the values of temperature, load and sliding distance were directly proportional to the value of wear properties and the value of B4C% was directly proportional to the wear properties. The knowledge on this classification is going to be useful for the technicians working with in the laboratory to fix the range of input parameters whereas mixing of various powders for preparing composites.
• Fuzzy logic will provide precise and timely assistance relating to the design and manufacture of P/M parts. The addition of B4C value for high, medium and low wear properties must in the range of -4.001% to 4.001%, 1.023% to 59.03% and 5.999% to 14% respectively.
• Also the developed soft computing proved that the addition of B4C with the composite Ti-6Al-4V will increase the strength and wear resistance of materials. These types of models will avoid expensive experimentation while preparing composite materials in the laboratory.
References
- Montealgere Melendez, Neubauer E, Angerer P, Torralba JM (2011) Influence of nano-reinforcements on the mechanical properties and microstructure of titanium matrix composites. Compos Sci Technol. 71(8): 1154-1162.
- YL Xi, Chai DL, Zhang WX, Zhou JE (2005) Ti-6Al-4V particle reinforced magnesium matrix composite by powder metallurgy. Mater lett. 59(14): 1831-1835.
- Godfrey TMT, Wisbey A, Goodwin PS, Bagnall CM, Ward-Close CM (2000) Microstructure and tensile properties of mechanically alloyed Ti-6Al- 4V with boron addition;” Mater Sci Eng A. 282: 240-250.
- Rui-Hua Hu, Jae-Kyoo Lim (2010) Hardness and wear resistance improvement of surface composite layer on Ti-6Al-4V substrate fabricated by powder sintering. Mater Des. 31: 2670-2675.
- Tang CY, Wong CT, Zhang LN (2013) In situ formation of Ti alloy/TiC porous composites by rapid microwave sintering of Ti-6Al-4V/MWCT powder. J alloys compd. 557(25): 67-72.
- Vettivel SC, Selvakumar N, Narayanasamy R, Leema N (2013) Numerical modelling, prediction of Cu–W nano powder composite in dry sliding wear condition using response surface methodology. Mater Des. 50: 977-996.
- Mohammed Sharifi E, Karimzadeh F, Enayati MH (2011) Fabrication and evaluation of mechanical and tribological properties of boron carbide reinforced aluminium matrix nanocomposites. Mater Des. 32(6): 3263-3271.
- Kobayashi M, Funami K, Suzuki S, Ouchi C (1998) Manufacturing process and mechanical properties of fine TiB dispersed Ti-6Al-4V alloy composites obtained by reaction sintering. Mater Sci Eng A. 243(1-2): 279-284.
- Poletti C, Balog M, Schubert T (2008) Production of titanium matrix composites reinforced with SiC particles. Compos Sci Technol. 68(9): 2171-2177.
- Zhang Zhi-Xiao, Du Xian-Wu, Wang Wei-Min, FU Zheng-Yi, Wang Hao (2014) Preparation and sintering of high active and ultrafine B4C-SiC composite powders. J Inorg Mater. 29(2): 185-190.
- Radha P, Chandrasekaran G, Selvakumar N (2015) Simplifying powder metallurgy manufacturing process using Soft computing tools. Applied Soft computing tools. 27(c): 197-207.
- Sha W, Edwards KL (2007) The use of artificial neural networks in materials science based research. Mater Des. 28(6): 1747-1752.
- Jiawei Han , Michaline Kamber (2011) Data Mining Concepts and Techniques. (3rd Edn), Elsevier: Netherlands.
- Reihanian M, Asadullahpour SR, Hajarpour S, Gheisari KH (2011) Application of neural network and genetic algorithm to powder metallurgy of pure iron. Mater Des. 32: 3183-3188.
- Temel Varol, Aykut Canakci and Sukru Ozsahin (2013) Artificial neural network modelling to effect of reinforcement properties on the physical and mechanical properties of Al2024–B4C composites produced by powder metallurgy. Compos: Part B. 54: 224–233.