Modeling and Simulation of EGF-CSF-1 pathway to Investigate Glioma - Macrophage Interaction in Brain Tumors
Elitas M*, Zeinali S
Sabanci Universtiy, Universite Cd., Tuzla, Istanbul, Turkey.
*Corresponding Author
Dr. Meltem Elitas,
Assistant Professor, Sabanci Universtiy, Universite Cd., No: 27, Tuzla, Istanbul, Turkey.
E-mail: melitas@sabanciuniv.edu
Received: May 12, 2016; Accepted: June 06, 2016; Published: June 09, 2016
Citation: Elitas M, Zeinali S (2016) Modeling and Simulation of EGF-CSF-1 Pathway to Investigate Glioma – Macrophage Interaction in Brain Tumors. Int J Cancer Stud Res. S5:001, 1-8. doi: http://dx.doi.org/10.19070/2167-9118-SI05001
Copyright: Elitas M© 2016. This is an open-access article distributed under the terms of the Creative Commons Attribution License, which permits unrestricted use, distribution and reproduction in any medium, provided the original author and source are credited.
Abstract
Glioblastoma multiform (GBM) is one of the most lethal forms of brain cancers. The biggest difficulties for diagnostics and treatment of GBM underlie in its dynamic and complex macro and microenvironment. Glioma cells, stromal cells and tumor-associated immune cells (microglia/macrophage-TAMs) become a complex tissue with their physical and chemical communication network. TAMs are the predominant infiltrating immune cells in malignant GBMs and stimulate tumor invasion, angiogenesis, and metastasis. The epidermal growth factor (EGF) and colony stimulating factor 1 (CSF-1) paracrine signaling loop plays a key role in communication between glioma cells and TAMs. We developed a mathematical model to investigate macrophage-glioma cell interactions using CSF-1 and EGF paracrine-acting agents. Our model presents change of EGF and CSF-1 concentration both on the surfaces of cells and within a well-defined tumor microenvironment, in a domain, with respect to interaction time and distance between TAMs and glioma cells. Our simulation results confirm that from low-grade glioma to high-grade glioma, concentration of CSF-1 increases both on the surfaces of macrophages and within the domain. Therefore, reproduction and adsorption of CSF-1 correlates with the grade of malignancy in human gliomas, which is a good agreement with recent findings.
2.Introduction
3.Model
5.Results and Discussion
6.Conclusion
7.Acknowledgments
8.References
Keywords
Glioblastoma; Signaling; EGF; CSF-1; Simulation; Paracrine.
Introduction
Glioblastoma multiform (GBM) is one of the most lethal forms of brain cancer in humans. Survival of patients could be extended up to 15 months with chemotherapy, radiation and surgery [1-4] yet, multiple challenge remains for better clinical outcomes [5, 6]. The biggest difficulties for diagnostic and treatment of GBM underlie in its complex macro and microenvironment. The macro environment of brain presents several complexities such as composing of several sensitive cell types to chemotherapeutic reagents, being surrounded by blood-brain barrier that limits delivery of drugs, and the skull that restricts growth of tumors. On the other hand, microenvironment of GBM is also highly complex, dynamic, hierarchical cell society due to presence of diverse cell types with distinct phenotypes and different proliferative potentials. GBM cells co-evolve with stromal and tumor-associated immune cells (microglia/macrophage) and form complex physical and chemical cell-cell communication network. TAMs are abundant and the predominant infiltrating immune cells in malignant GBMs, which are present at World Health Organization (WHO) grade II-IV gliomas [7-10]. During tumor progression, macrophages can stimulate tumor invasion, angiogenesis, and metastasis [11]. Although the role of infiltrated macrophages in tumor progression has been recognized, still the precise nature of the interaction mechanisms between tumor cells and macrophages has not been elucidated [12]. Mills et al. extended an in vivo model for the function of TAMs and suggested two states of TAMs as activated (M1) and alternatively activated (M2) macrophages [13]. M1 and M2 TAMs differ in activating signals, expression of receptors, cytokine production and biological behavior. This suggestion describes that TAMs with M1 polarization are foes and TAMs with M2 polarization are friends for tumors [7-13].
Tumor-derived molecules, such as colony-stimulating factor 1(CSF-1), can polarize glioma-infiltrating macrophages towards M2 polarization and result in production of anti- inflammatory molecules [14-16] and epidermal growth factor (EGF), which acts in return on EGF receptor (EGFR) on the carcinoma cells to promote invasion [17]. EGF-CSF-1 signaling affects the ratio of cell types in aggregates and enables glioma cells to infiltrate into the brain parenchyma [5]. Since GBMs are highly complex with unpredictable patterns, several mathematical models have been used to reveal its complexity and predict its progress [18, 19]. Particularly, compared to other scientific boards, neuro- oncology still requires more effort to propose predictive tools that could accurately simulate the behavior of malignant gliomas [20, 21]. Martirosyan and his co-workers summarized the mathematical models that describe different aspects of GBM growth and evaluastion such as spheroid models, metabolic and vascular models, morphological models, and treatment models [20].
Among them, spheroid models represent a powerful theoretical framework to study initial growth of GBM when proliferation and diffusion of glioblastoma cells are the major players in the tumor initiation. These types of models composed of reactiondiffusion models, simple discrete models and continuum models. Stein et al. used bright field image sequences to estimate number of cells in the tumor spheroids and described a continuum mathematical model to quantitatively interpret the data [22]. After fitting quantitative and experimental data, they observed that glioma cells with EGF receptor show less cell-cell adhesion and invade in a more biased manner and greater rate [22]. Banerjee et al. developed a mathematical model considering the interactive dynamics of glioma cells, macrophages, cytotoxic T-lymphocytes and T11 Target structure (T11TS),
which is a membrane glycoprotein and affects the functional state of immune cells. Their model concluded that T11T structure might be used as a drug target for effective treatment of brain tumors [6]. Aubert and Bandoual proposed a two dimensional model that quantified the strength of cell-cell adhesion using a probability threshold [23]. The agreement of mathematical modeling with experimental results approved that cell-cell adhesion is extremely important for the growth and behavior of glioma cells [23, 24]. Considering biased diffusion in glioblastoma, Fort and Sole’s improved standard reaction-diffusion-advection model pointed that glioma cells move in a bias towards the invasion front instead of moving equally in all directions. It provides a great agreement with experiments [25].
The vascular and metabolic models are related to invasiveness and aggressiveness of the tumor that requires more nutrient supply consequently; these models oftentimes predict the onset of angiogenesis and creation of vasculature [20]. In this concept, some models analysed collective cell migration, tumor cell spatial distribution, morphology and viability using conservation laws [26-28]. Some models were compartmentalized via dividing tumor cell populations into normal, hypoxic, and necrotic cell groups to cover all dynamics of tumor microenvironment [19, 29, 31]. Some models investigated the phenotypic switch that occurs from proliferative state to invasive state in glioma cells as function of hypoxia [32]. The morphological models uses discrete models and reaction- diffusion models to investigate the microscopic and macroscopic morphological changes, glioma growth, invasion based on cell-cell and cell-extracellular matrix adhesion, hypoxia, chemotaxis, homotype attractions, substrate gradients (glucose, oxygen) and other microenvironmental parameters [33-36]. In the treatment models the ultimate goal is providing solutions for better treatment outcome, prolonging and improving patient life. As mentioned, treatment of glioblastoma is not very efficient compared to other cancer types and better strategies are urgently needed. The modeling strategies target better treatment regimen using radiotherapy, chemotherapy, patient MRI data and resection in conjunction with two-, three- and four-dimensional computer modeling systems [37]. Thus, chemotherapy and radiotherapy is able to simulated with different drugs [38] and dose schedules, partial resection of tumor and filling the ablated volume with different chemicals such as cerebrospinal fluid, chemoattractants [39].
Despite efforts to understand the dynamics of glioma cells and macrophage interactions, little data is available to suggest the partnership between glioma cells and M2 type TAMs. However, most of the findings are based on human end-stage tumor samples obtained from surgical secretions. In order to reveal the nature of interaction between glioma cells and macrophages, efforts may focus on studying the nature of interaction between glioma cells and macrophages arises at tumor onset [8]. Based on the need for better understanding of the macrophage-tumor cell interactions in tumor microenvironment, mathematical models, which reveal and simulate the nature of these interactions, are of high challenge and consideration. In this work, we present a computational model for further investigation of macrophage-glioma cell interactions focusing on concentration change of paracrine-acting agents (CSF-1 and EGF) in a defined microenvironment (domain) and on the cellular surfaces.
Model
Recent clinical experiments reported that TAMs facilitate invasiveness of GBM through EGF- CSF-1 paracrine signaling loop [17]. Macrophages secrete EGF and respond to CSF-1; similarly glioma tumor cells express CSF-1 and respond to EGF via chemotaxis, Figure 1a. This cooperation enables glioma cells to coordinate their aggregation and migration via macrophagefacilitated dissemination from primary tumor to surrounding healthy brain tissue [5, 16, 17]. To investigate the paracrine interaction between glioma cells and macrophages through the EGF and CSF-1 signaling [40]; we present a case study, as illustrated in Figure 1b. We propose that there is a macrophage accumulation at the vicinity of glioma cell population in the tumor microenvironment, that could appear where the blood brain barrier or the blood vessel is impaired and immune cells could colonized at the periphery of a solid tumor mass [41-44] in vivo. While Boyden Chamber assays could be considered as examples in vitro [44], where chemotaxis and cell migration studies have been frequently performed between two different cell types through 3-12 μm pore-sized filters [44]. In our model, the vicinity of two cell types in the tumor microenvironment is labeled as domain. The domain defines boundaries (5 μm x 25 μm) to determine the secreted and bounded signaling reagents and their concentration gradient during the different phases of glioma.
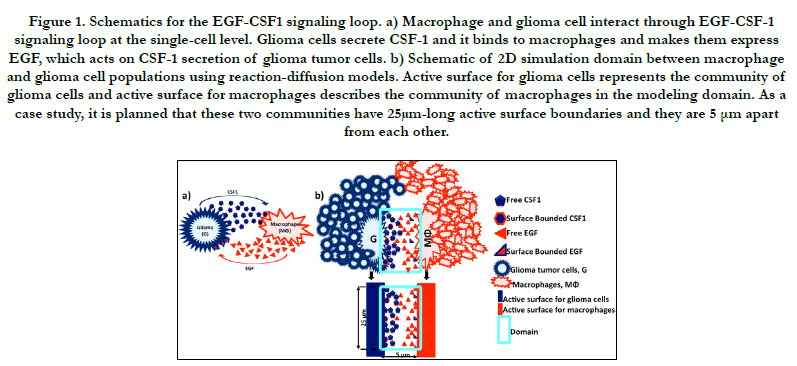
Figure 1. Schematics for the EGF-CSF1 signaling loop. a) Macrophage and glioma cell interact through EGF-CSF-1 signaling loop at the single-cell level. Glioma cells secrete CSF-1 and it binds to macrophages and makes them express EGF, which acts on CSF-1 secretion of glioma tumor cells. b) Schematic of 2D simulation domain between macrophage and glioma cell populations using reaction-diffusion models. Active surface for glioma cells represents the community of glioma cells and active surface for macrophages describes the community of macrophages in the modeling domain. As a case study, it is planned that these two communities have 25μm-long active surface boundaries and they are 5 μm apart from each other.
In our modeling, we numerically solve the equations that govern the movement and binding of CSF-1 and EGF. Fick’s second law explains diffusive transport, where D is the diffusion coefficient. C is the concentration of species, Δ is Laplacian and t is time.
Incorporating reaction-diffusion modeling, the nature of interaction in the paracrine-signaling loop is described as follows [45]:
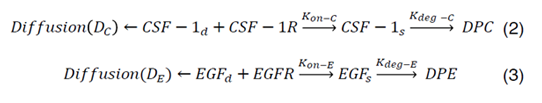
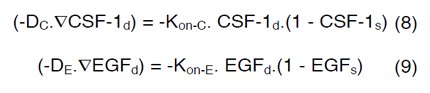
CSF-1R represents the concentration of receptors on macrophage cell surface for binding of CSF-1 secreted by glioma cells and EGFR represents the concentration of receptors located on glioma cell surface for binding of EGF secreted by macrophages. Kon-C and Kon-E incorporate the rate constants for CSF-1R and EGFR binding, respectively. Moreover, CSF-1s and EGFs are surface species and represent the concentration of bound CSF-1 on the macrophage and bound EGF on the glioma cell surfaces. Kdeg-C and Kdeg-E are the rate constants for degradation of CSF-1s and EGFs. DPC and DPE are the degradation of products. The CSF-1d and EGFd are bulk species in the domain and introduced at the rate of ∂C and ∂E at specific locations and have effective diffusion coefficient of DC and DE, respectively. In our calculations, including surface reaction and bulk diffusion expressions (2) and (3) are described with the following equations [45]:
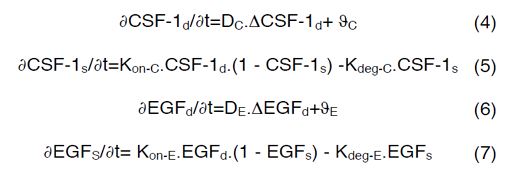
Equations (4) and (6) are surface-reaction expressions and include the concentrations of free species (CSF-1d and EGFd) and should be solved in combination with the mass balance of species in the domain. The coupling between bulk and surface expressions is obtained as boundary condition in the bulk’s mass expressions (equations (4) and (6)), which sets the flux of CSF-1d and EGFd at the active surfaces.
Our mathematical model is based on the following assumptions:
- The physical and chemical properties of domain and surface CSF-1 and EGF. eagents are uniform and continuous.
- The mass balance of the domain has been coupled to the mass balances of CSF-1 and EGF present on the active surfaces.
- The initial condition concentrations of CSF-1 and EGF are zero.
In order to couple the reaction-diffusion expressions of CSF- 1 and EGF, we have assumed that Kon-E varies based on the concentration of macrophages and glioma cells in the domain and a linear correlation occurs between ∂C, ∂E, Kon-C and Kon-E as follows,
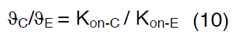
Therefore, the value of Kon-E for each glioma grade could be determined from equation (10). Definitions, default values and their references are provided in Table 1 [46-50].
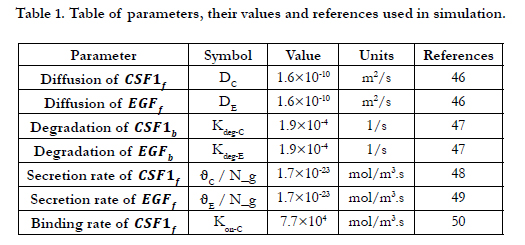

Table 1. Table of parameters, their values and references used in simulation.
The mathematical modeling deals with a diffusion occurring in a 2D domain, which is coupled, to a surface reaction phenomenon occur on a part of the domain’s boundary. The phenomenon in the domain refers to introduction of CSF-1d from the glioma and EGFd from the macrophages as sources and the surface phenomenon describes the binding of species from the domain to the active surfaces that reactions take place. Equations (4) and (6) are modeled using Transport of Diluted Species interface and equations (5 and 7) are described with General Form Boundary PDE interface in COMSOL Multiphysics 5. The equations of two interfaces are coupled considering expressions (8) and (9) as boundary conditions.
The concentration of species in the domain and on the surfaces of the cells has been affected from the interaction of macrophages and glioma cells that are present in the domain. In this study, WHO grade I-IV gliomas are considered based on the concentration of glioma and macrophages. Table 2 describes number of macrophages and glioma cells at each grade of glioma brain cancer [51]. It is important to point that, in our model given the nature of paracrine loop, the number of macrophages decreases with WHO grade I-IV gliomas, while the number of tumor-cells increases. One of the reasons for this assumption in our scenario is the tumor cells are continuously dividing and increasing their number, however once the monocytes differentiated and became active immune cells (macrophages) they cannot divide. Besides, it is assumed that all macrophages are infiltrating into tumor mass from the surrounding tissue, (vasculogenesis and angiogenesis are ignored) when the grade of the tumor increases, the number of macrophages that can diffuse inside the tumor decreases as well as the rate of replenishment of microglia from monocytes reduces. Moreover, microglia stimulates glioblastoma invasion [55] and proliferation; as a consequence glioma cells grow fast. To sum up, in our model the number of macrophages decreases with increased WHO grade of glioma [52-58]. We calculated the value of Kon-E using equation (10) and using the number of macrophages [52] and glioma cells from Table 2 [59].
Due to simplicity and being a general assumption for mathematical models a linear relation between the number of cells and Kon-E value has been chosen in Eq. 10. However, the model can be improved and more realistic studies could be performed considering amplification and overexpression of EGFR receptors, dynamics of receptor changes at the cellular surfaces due to dynamics of cell population such as epithelial to mesenchymal transition, receptor dysregulations, level of autophosphorylation and frequency of mutations [59-63].
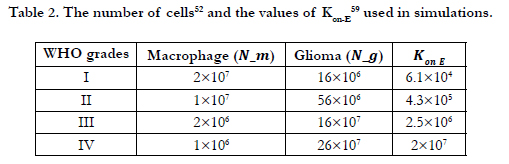
Table 2. The number of cells52 and the values of Kon-E 59 used in simulations.
Results and Discussion
In this work, we have developed a continuum mathematical model that simulates the concentrations of EGF and CSF-1 paracrine reagents for the surface-bounded species on the active surfaces of macrophages, CSF-1s (mol/m2) and on the active surfaces of glioma tumor cells, EGFs (mol/m2), the secreted CSF-1d (mol/ m3) and EGFd (mol/m3) as bulk concentrations (free reagents) in the domain. The simulations were performed for 24 hours. Figure 2 shows the schematic view and the change of CSF-1d after 24 hours of interaction between macrophages and glioma tumor cells in the domain for all WHO grades of gliomas (I (a), II (b), III (c) and IV (d)). According to modeling results, all color tables of Figure 2 are assigned to have 1.76×10⁻²⁶ as minimum (blue) and 3.45×10⁻¹⁶ (red) as maximum reference values for CSF-1d.
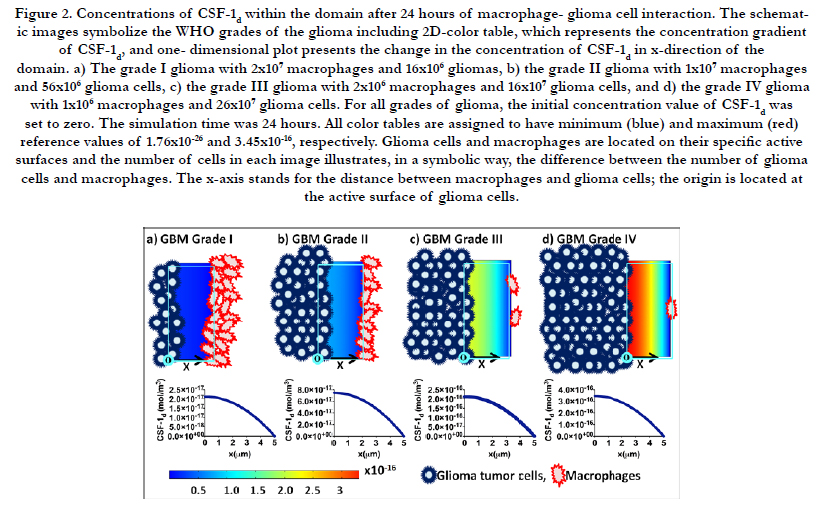
Figure 2. Concentrations of CSF-1d within the domain after 24 hours of macrophage- glioma cell interaction. The schematic images symbolize the WHO grades of the glioma including 2D-color table, which represents the concentration gradient of CSF-1d, and one- dimensional plot presents the change in the concentration of CSF-1d in x-direction of the domain. a) The grade I glioma with 2x10⁷ macrophages and 16x106 gliomas, b) the grade II glioma with 1x10⁷ macrophages and 56x106 glioma cells, c) the grade III glioma with 2x10⁶ macrophages and 16x107 glioma cells, and d) the grade IV glioma with 1x10⁶ macrophages and 26x107 glioma cells. For all grades of glioma, the initial concentration value of CSF-1d was set to zero. The simulation time was 24 hours. All color tables are assigned to have minimum (blue) and maximum (red) reference values of 1.76x10⁻²⁶ and 3.45x10⁻¹⁶, respectively. Glioma cells and macrophages are located on their specific active surfaces and the number of cells in each image illustrates, in a symbolic way, the difference between the number of glioma cells and macrophages. The x-axis stands for the distance between macrophages and glioma cells; the origin is located at the active surface of glioma cells.
Likewise, Figure 3 shows the concentration gradient of EGFd after 24 hours interaction among macrophages and glioma tumor cells in the domain. The reference minimum value of EGFd is 4.25×10⁻³⁰ (blue) and the reference maximum value is 2.67×10⁻¹⁷ (red) for the color table. The schematic images represent that the ratio for number of glioma cells to number of macrophages. Grade I glioma is close to 1; this ratio increases from grade I to grade IV, and reaches 260 at grade IV glioma.
One-dimensional plots in Figure 2 and Figure 3 illustrate the change in the concentration of CSF-1d and EGFd in x-direction of the domain for each stage. The x-axis represents the average displacement between the population of glioma cells and macrophages; it starts from the active surface of glioma cells (x = 0 μm) and ends at the active surface of macrophages (x = 5 μm). Consequently, the concentration of CSF-1d decreases through the x-direction of the domain and reaches the approximate value of zero at x = 5 μm.
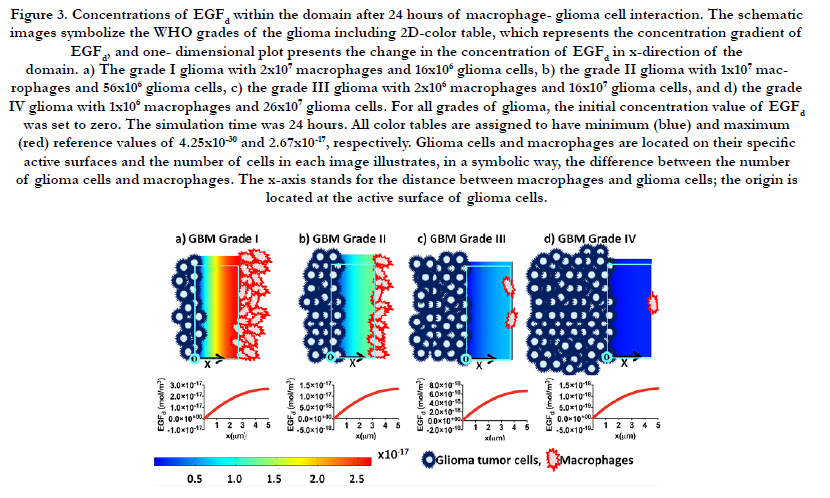
Figure 3. Concentrations of EGFd within the domain after 24 hours of macrophage- glioma cell interaction. The schematic images symbolize the WHO grades of the glioma including 2D-color table, which represents the concentration gradient of EGFd, and one- dimensional plot presents the change in the concentration of EGFd in x-direction of the domain. a) The grade I glioma with 2x10⁷ macrophages and 16x106 glioma cells, b) the grade II glioma with 1x10⁷ macrophages and 56x106 glioma cells, c) the grade III glioma with 2x10⁶ macrophages and 16x107 glioma cells, and d) the grade IV glioma with 1x10⁶ macrophages and 26x107 glioma cells. For all grades of glioma, the initial concentration value of EGFd was set to zero. The simulation time was 24 hours. All color tables are assigned to have minimum (blue) and maximum (red) reference values of 4.25x10⁻³⁰ and 2.67x10⁻¹⁷, respectively. Glioma cells and macrophages are located on their specific active surfaces and the number of cells in each image illustrates, in a symbolic way, the difference between the number of glioma cells and macrophages. The x-axis stands for the distance between macrophages and glioma cells; the origin is located at the active surface of glioma cells.
When the concentrations of adsorbed species on the cellular surface increase with time, the concentrations of domain species (CSF-1d and EGFd) decrease due to adsorption by active surfaces and coupling of reaction and diffusion phenomena at all glioma grades. For the grade I glioma, the number of macrophages was 1.25 times higher than the number of glioma cells in the domain. At grade II gliomas, macrophages are 0.17 times of glioma cells in the domain and the concentration of CSF-1s and CSF-1d was approximately 5.5 times of the concentration of EGFs and EGFd. For grade III and IV gliomas the ratio of macrophages to glioma cells are 0.01 and 0.003 and the ratio of CSF-1 species to EGF species are approximately 32 and 260, respectively. From grade I to grade IV gliomas, the ratio of macrophages to glioma cells uniformly decreased, but based on the observations from the modeling this approximate uniformity could not be generalized to the ratio of domain species to surface species at each grade of glioma.
Figure 4 shows that for both species of CSF-1, grade I glioma has the minimum concentration and towards high-grade glioma, which means increasing in the ratio of glioma cells to macrophages, CSF-1 bulk and surface species experience higher concentrations. Despite the CSF-1 species, Figure 5 illustrates that EGF species have the minimum concentrations for grade IV gliomas where the ratio of macrophages to glioma cells is the minimum.
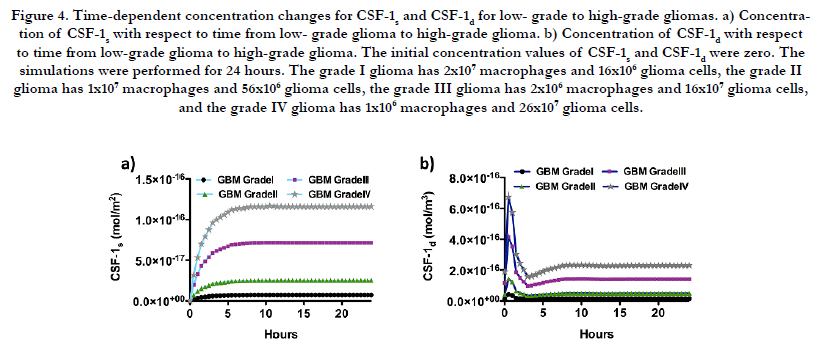
Figure 4. Time-dependent concentration changes for CSF-1s and CSF-1d for low- grade to high-grade gliomas. a) Concentration of CSF-1s with respect to time from low- grade glioma to high-grade glioma. b) Concentration of CSF-1d with respect to time from low-grade glioma to high-grade glioma. The initial concentration values of CSF-1s and CSF-1d were zero. The simulations were performed for 24 hours. The grade I glioma has 2x10⁷ macrophages and 16x106 glioma cells, the grade II glioma has 1x10⁷ macrophages and 56x106 glioma cells, the grade III glioma has 2x10⁶ macrophages and 16x107 glioma cells, and the grade IV glioma has 1x10⁶ macrophages and 26x107 glioma cells.
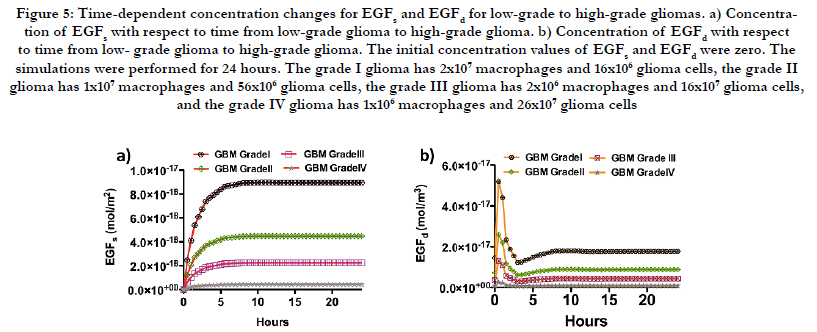
Figure 5: Time-dependent concentration changes for EGFs and EGFd for low-grade to high-grade gliomas. a) Concentration of EGFs with respect to time from low-grade glioma to high-grade glioma. b) Concentration of EGFd with respect to time from low- grade glioma to high-grade glioma. The initial concentration values of EGFs and EGFd were zero. The simulations were performed for 24 hours. The grade I glioma has 2x10⁷ macrophages and 16x106 glioma cells, the grade II glioma has 1x10⁷ macrophages and 56x106 glioma cells, the grade III glioma has 2x10⁶ macrophages and 16x107 glioma cells, and the grade IV glioma has 1x10⁶ macrophages and 26x107 glioma cells
Conclusion
There is a growing recognition in the literature regards the role of microglia and macrophages in glioma maintenance and progression [66]; however, we still could not clearly reveal which factors trigger the interaction between glioma cells and macrophages. TAMs infiltrate into the glioma microenvironment, secrete various growth factors, cytokines and chemokine, perform both immune and tumor supportive behaviors. And, in this relation one of the most studied interaction ways for TAMs and glioma cells is CSF-1 and EGF paracrine loop. In glioma microenvironment, CSF-1 is a chemoattractant for TAMs and enrols in their differentiation, migration and survival [64]. In addition, TAMs release EGF, which facilitates glioblastoma proliferation, invasion and recurrence [5]. Although we could not entirely uncover the underlying interaction mechanisms between CSF-1 and EGF, due to urgently needed new targets for glioma treatment, researchers stared to develop TAM-targeted glioma therapies [66-73]. Pyonteck et al., found that CSF-1R inhibition blocks glioma unexpected growth, progression and invasion [64]. Therefore, CSF-1 has become one of the promising targets in the glioblastoma multiform and its reproduction and adsorption expected to be increased from low to high-grade gliomas. Our mathematical modeling approves the high reproduction of CSF-1 at high-grade gliomas as reported by Coniglio and his colleagues [5]. They observed that CSF-1 levels were elevated in higher-grade gliomas and approved that glioblastoma invasion completely depended on CSF-1R signalling [5]. Bender et al., proposed that in a genetic screen for oncogenes driving astrocytomas, CSF-1 was regulated in nearly 70% of spontaneous astrocytomas [64]. Our contribution is presenting a simple mathematical model that accurately determines paracrine loop between macrophages and glioma cells through CSF-1 and EGF interaction for grades I to IV human glioma disease. Our simulation results represent the difference in the surface-bounded (CSF-1s - EGFs) and bulk expressed (CSF-1d - EGFd) paracrine-signaling reagents of CSF-1 and EGF both at spatial and temporal resolutions. Most of the current models focus only on measuring the total concentration of signalling reagents in a constant domain. We improved these models and presented the behaviour of surface-bounded signalling molecules and free signalling reagents of the domain. The results clearly showed the concentration change of signalling molecules in time and their gradient distribution in the domain.
In our mathematical model, increasing the WHO grades of glioblastoma increases the concentration of signalling molecules both in the domain and on the surfaces of the cells. Glioma cells express more CSF-1 in the bulk and macrophages being affected from this high supply, adsorb more CSF-1 on their surfaces until they reach the steady state. Although in this model we used a linear relation between the malignancy grades of gliomas and signalling molecule-binding rates (Kon_E, Kon_C), the model can be improved to be more realistic considering the amplification and overexpression of the signalling receptors, receptor dysregulations, levels of autophosphorylation, and dynamics of cell population (frequency of mutations, receptor changes due to epithelial to mesenchymal transitions, etc.) [61, 62].
Moreover, in our model the increase in the concentration of CSF- 1 and decrease in the concentration of EGF do not obey the uniform change in the number of macrophages and glioma cells. In other words, we aimed to show that not only the increased number of glioma cells due to high-grade glioma contributes to increased CSF-1 concentration but also paracrine interactions [51] between macrophages and glioma cells modulate the CSF- 1 concentration, which is created via coupling the reactiondiffusion expressions of CSF-1 and EGF in our model. Likewise, in our scenario, the decreased number of macrophages compared to increased number of tumor cells with the grade of glioma is different compared to majority of the modeling studies. The reasons behind our assumption were once the monocytes differentiated and become macrophages they cannot proliferate like tumor cells. Besides, when the grade of tumor increases, concentrations of diffused reagents into the tumor mass decrease [74], the number of infiltrated macrophages decreases due to ignored vasculogenesis and angiogenesis in the tumor microenvironment.
Based on our scenario the model accurately generates consistent results with expectations. Our goal was mimicking a macrophage accumulation at the vicinity of glioma cell population in the tumor microenvironment, that could appear where the blood brain barrier or the blood vessel is impaired and immune cells could colonized at the periphery of a solid tumor mass [41-44] in vivo. While Boyden Chamber assays could be considered as examples in vitro [44]. However, this model allows introducing different types of cytokines (more signalling pathways) and cell types (glioma stem cells, astrocytes, and microglia) of glioma microenvironment while providing possibilities of upgrading cellular interaction domain from 2D to 3D microenvironment, where complexity, dynamic cellular distribution of different cell types and heterogeneity of glioma microenvironment will be more realistically mimicked and the obtained results will be extensively contributed to the development of personalized treatment and drug test models for human brain tumors.
Last but not least, in order to develop more predictive and realistic models to investigate tumor-immune cell interactions, we should experimentally generate more quantitative data with more sampling time. Unfortunately, as it has been reported in D. Hambardzumyan, D. H. Gutmann and H. Kettenmann’s review paper, majority of the obtained data in neuro-oncology are not consistent [66]. Therefore, more attention should be given when the models will be tested using the data from the literature.
Acknowledgments
I would like to acknowledge the Faculty of Engineering and Natural Sciences, Sabanci University fund and support.
References
- Louis DN, Ohgaki H, Otmar DW, Webster KC, Peter CB, Anne J, et al., (2007) The 2007 WHO Cassification of tumours of the central nervous system. Acta Neuropathol 114(2): 97–109.
- Preusser M, de Ribaupierre S, Wöhrer A, Erridge SC, Hegi M, Weller M, et al., (2011) Current concepts and management of glioblastoma. Annals of Neurology 70(1): 9-21.
- Stupp R, Mason WP et al., (2005) Radiotherapy plus concomitant and adjuvant temozolomide for glioblastoma. New England Journal of Medicine 352(10): 987-996.
- Demuth T, Berens ME (2004) Molecular mechanisms of glioma cell migration and invasion. J Neurooncol 70(2): 217-228.
- Coniglio SJ and Segall JE (2013) Review: molecular mechanism of microglia stimulated glioblastoma invasion. Matrix Biology 32(7-8): 372-380.
- Banerjee S, Khajanchi S, Chaudhuri S (2015) A Mathematical Model to Elucidate Brain Tumor Abrogation by Immunotherapy with T11 Target Structure. PLoS One 10(5): e0123611.
- Noy R. and Pollard JW (2014) Tumor-associated macrophages: from mechanisms to therapy. Immunity 41(1): 49-61.
- Kennedy BC et al. (2013) Tumor-Associated Macrophages in Glioma: Friend or Foe? Journal of Oncology 11. ID 486912.
- Kostianovsky AM, Maier LM, Anderson RC, Bruce JN, Anderson DE (2008) Astrocytic regulation of human monocytic/microglial activation. J Immunol 181(8): 5425-5432.
- Rao JS (2003) Molecular mechanisms of glioma invasiveness: the role of proteases. Nat Rev Cancer 3(7): 489-501.
- Jeon JS, Bersini S, Gilardi M, Dubini G, Charest JL, Moretti M , et al. (2015) Human 3D vascularized organotypic microfluidic assays to study breast cancer cell extravasation. Proceedings of the National Academy of Sciences 112(1):214-219.
- Korbelik M and Hamblin RM (2015) The impact of macrophage- cancer cell interaction on the efficacy of photodynamic therapy. Photochemical & Photobiological Sciences 14(8): 1403-1409.
- Mills CD (2012) M1 and M2 macrophages: oracles of health and disease. Crit Rev Immunol 32(6): 463-488.
- Li W, Graeber MB (2012) The molecular profile of microglia under the influence of glioma. Neuro-Oncology 14(8): 958-978.
- Douglass TG, et al. (2008) Macrophage colony stimulating factor: not just for macrophages anymore! A gateway into complex biologies. International Immunopharmacology 8(10): 1354-1376.
- Wyckoff JB, et al. (2007) Direct visualization of macrophage-assisted tumor cell intravasation in mammary tumors. Cancer Research 67(6): 2649-2656.
- Goswami S, et al. (2005) Macrophages promote the invasion of breast carcinoma cells via a colony-stimulating factor-1/epidermal growth factor paracrine loop. Cancer Research 65(12): 5278-5283.
- Nakada M (2011) Aberrant signaling pathways in Glioma. Cancers 3(3): 3242-3278.
- Swanson KR, et al. (2011) Quantifying the role of angiogenesis in malignant progression of gliomas: In Silico modeling integrates imaging and histology. Cancer Research 71(24): 7366-7375.
- Martirosyan NL, et al. (2015) Mathematically modeling the biological properties of gliomas: a review. Math Biosci Eng 12(4): 879-905.
- Hatzikirou H, Deutsch A, Schaller C, Simon M, Swanson K (2005) Mathematical modelling of glioblastoma tumour development: a review . Mathematical Models and Methods in Applied Sciences 15(11): 1779-1794.
- Stein AM, Demuth T, Mobley D, Berens M, Sander LM (2007) A Mathematical Model of Glioblastoma Tumor Spheroid Invasion in a Three-Dimensional In Vitro Experiment. Biophys J 92(1): 356–365.
- Aubert M, Badoual M, Féreol S, Christov C, Grammaticos B (2006) A cellular automaton model for the migration of glioma cells. Phys Biol 3(2): 93-100.
- Badoual M, Deroulers C, Aubert M, Grammaticos B (2010) Modelling intercellular communication and its effects on tumour invasion. Phys Biol 7(4): 046013.
- Joaquim F, Sole RV (2013) Accelerated tumor invasion under non-isotropic cell dispersal in glioblastomas. New Journal of Physics 15: 055001.
- Ferreira SC, Martins Jr ML and Vilela MJ (2002) Reaction-diffusion model for the growth of avascular tumor. Physical Review E 65: 021907.
- Frieboes HB, Lowengrub JS, Wise S, Zheng X, Macklin P, Bearer EL, et al. (2007) Computer simulation of glioma growth and morphology. NeuroImage 37(Suppl 1): S59-S70.
- Frieboes HB, Zheng X, Sun CH, Tromberg B, Gatenby R, Cristini V (2006) An integrated computational/experimental model of tumor invasion. Cancer Research 66(3): 1597-1604.
- Martínez-González A, Calvo GF, Pérez Romasanta LA, Pérez-García VM (2012) Hypoxic cell waves around necrotic cores in glioblastoma: A biomathematical model and its therapeutic implications. Bull Math Biol 74(12): 2875-2896.
- Papadogiorgaki M, Koliou P, Kotsiakis X, Zervakis ME (2013) Mathematical modelling of spatio-temporal glioma evolution. Theoretical Biology and Medical Modelling 10: 47.
- Szeto MD, Chakraborty G, Hadley J, Rockne R, Muzi M, Alvord Jr EC, et al. (2009) Quantitative metrics of net proliferation and invasion link biological aggressiveness assessed by MRI with hypoxia assessed by FMISO-PET in newly diagnosed glioblastomas. Cancer Res 69(10): 4502–4509.
- Hatzikirou H, Basanta D, Simon M, Schaller K, Deutsch A (2012) ‘Go or Grow’: the key to the emergence of invasion in tumour progression? Mathematical Medicine and Biology 29(1): 49-65.
- Sander LM, Deisboeck TS (2002) Growth patterns of microscopic brain tumors. Phys Rev E Stat Nonlin Soft Matter Phys 66(5 pt 1): 051901.
- Turner S, Sherratt JA (2002) Intercellular adhesion and cancer invasion: a discrete simulation using the extended Potts model. Journal of Theoretical Biology 216(1): 85-100.
- Gao S, Wei X (2012) Analysis of a mathematical model of glioma cells outside the tumor spheroid core. Applicable Analysis 92(7): 1379-1392.
- Bearer EL, et al. (2009) Multiparameter computational modeling of tumor invasion. Cancer Research 69(10): 4493-4501.
- Tian JP, Friedman A, Wang J,Chiocca EA (2009) Modeling the effects of resection, radiation and chemotherapy in glioblastoma. J Neurooncol 91: 287-293.
- Stamatakos GS, Antipas VP, Uzunoglu NK, Dale RG (2006) A four- dimensional computer simulation model of the in vivo response to radiotherapy of glioblastoma multiforme: studies on the effect of clonogenic cell density. The British Journal of Radiology 79(941): 389-400.
- Eikenberry SE, Sankar T, Preul MC, Kostelich EJ, Thalhauser JC, Kuang Y (2009) Virtual glioblastoma: growth, migration and treatment in a threedimensional mathematical model. Cell Prolif 42(4): 511-528.
- Elitas M, Brower K, Lu Y, Chen JJ, Fan R (2014) A microchip platform form interrogating tumor-macrophage paracrine signaling at the single-cell level. Lab Chip 14(18): 3582-3588.
- Polajeva J, et al. (2011) Mast cell accumulation in glioblastoma with a potential role for stem cell factor and chemokine CXXL12. PLoS One 6(9): e25222.
- Voisin P, et al. (2010) Microglia in close vicinity of glioma cells: Correlation between phenotype and metbolic alterations. Front Neuroenergetics 2: 1-15.
- Zhang J, Sarkar S, Cua R, Zhou Y, Hader W, Yong VW (2012) A dialog between glioma and microglia that promotes tumor invasiveness through the CCL2/CCR2/interleukin-6 axis. Carcinogenesis 33(2): 312-319.
- Hulkower KL, Herber RL (2011) Cell migration and invasion assays as tools for drug discovery. Pharmaceutics 3(1): 107-124.
- Kerszberg M, Wolpert L (1998) Mechanisms for positional signalling by morphogen transport: a theoretical study. Journal of Theoretical Biology 191(1): 103-114.
- Thorne RG, Hrabětová S, Nicholson C (2004) Diffusion of epidermal growth factor in rat brain extracellular space measured by integrative optical imaging. Journal of Neurophysiology 92(6): 3471-3481.
- Ross HJ, Moy LA, Kaplan R, Figlin RA (1991) Bullous pyoderma gangrenosum after granulocyte colony-stimulating factor treatment. Cancer 68(2):441-443.
- Nitta T, et al. (1992) Expression of granulocyte colony stimulating factor and granulocyte-macrophage colony stimulating factor genes in human astrocytoma cell lines and in glioma specimens. Brain Research 571(1): 19-25.
- Mishima K, et al. (1998) Heparin-binding epidermal growth factor-like growth factor stimulates mitogenic signaling and is highly expressed in human malignant gliomas. Acta Neuropathol 96(4): 322-328.
- Ma X, et al. (2012) Structural basis for the dual recognition of helical cytokines IL-34 and CSF-1 by CSF-1R. Structure 20(4): 676-687.
- Wu Y, Lu Y, Chen W, Fu J, Fan R (2012) In silico experimentation of glioma microenvironment development and anti-tumor therapy. PLoS Comput Biol 8(2): e1002355.
- Hussain SF, Yang D, Suki D, Aldape K, Grimm E, et al. (2006) The role of human glioma-infiltrating microglia/macrophages in mediating antitumor immune responses. Neuro-oncol 8(3): 261-279.
- Morantz RA, Wood GW, Foster M, Clark M, Golahon K (1979) Macrophages in experimental and human brain tumors. Part 2: studies of the macrophage content of human brain tumors. J Neurosurg 50(3): 305-311.
- Kostianovsky AM, Maier LM, Anderson RC, Bruce JN, Kostianovsky AM, Maier LM, et al. (2008) Anderson, Astrocytic regulation of human monocytic/ microglial activation. J Immunol 181(8): 5425-5432.
- Kimberleve RR, Kucheryavykh YV, Cubano LA, Inyushin M, Skatchkov SN, Eaton MJ, et al. (2015) Microglia activate migration of glioma cells through a Pyk2 intracellular pathyway. PLoSOne 10(6): e0131059.
- Komohara Y, et al. (2012) Importance of direct macrophage-tumor cell interaction on progression of human glioma. Cancer Sc 103(12): 2165-2172.
- Zhaou W, Bao S (2014) Reciprocal supportive interplay between glioblastoma and tumor-associated macrophages. Cancers 6(2): 723-740.
- Mishima K, et al. (1998) Heparin-binding epidermal growth factor-like growth factor stimulates mitogenic signaling and is highly expressed in human malignant gliomas. Acta Neuropathol. 96(4): 322–328.
- Padfield E, Ellis HP, Kurian KM (2015) Current therapeutic advances targeting EGFR and EGFRvIII in glioblastoma. Front. Oncol 5: 5. doi: 10.3389/ fonc.2015.00005.
- Nakada M, Kita D, Watanabe T, Hayashi Y, Teng L, et al. (2011) Aberrant Signaling Pathways in Glioma Cancers. Cancers 3(3): 3242-3278.
- Viana-Pereira M, Lopes JM, Little S, Milanezi F, Basto D, Pardal F, et al. (2008) Anaysis of EGFR overexpression, EGFR gene amplification and EGFRvIII Mutation in Protuguese High-grade gliomas. Anticancer Research 28(2A): 913-920.
- Taylor TE, Funari FB, Cavenee WK (2012) Targeting EGFR for treatment of glioblastoma: Molecular basis to overcome resistance. Curr. Cancer Drug Targets 12(3): 197-209.
- Pyonteck SM, et al. (2013) CSF-1R inhibition alters macrophage polarization and blocks glioma progression. Nature Medicine 19(10): 1264-1272.
- Bender AM, et al. (2010) Sleeping Beauty-mediated somatic mutagenesis implicates CSF1 in the formation of high grade astrocytomas. Cancer Research 70(9): 3557-3565.
- Graf MR, Jadus MR, Hiserodt JC, Wepsic HT, Granger GA (1999) Development of systemic immunity to glioblastoma multiforme using tumor cells genetically engineered to express the membrane-associated isoform of macrophage colony- stimulating factor. The journal of Immunology 163(10):5544- 5551.
- Hambardzumyan D, Gutmann DH, Kettenmann H (2015) The role of microglia and macrophages in gliioma maintenance and progession. Nature Neuroscience 19(1): 20-27.
- Sarkar S, et al. (2014) Therapeutic activation of macrophages and microglia to suppress brain tumor-initiating cells. Nature Neuroscience 17(1): 46–55.
- Kioi M, Vogel H, Schultz G, Hoffman RM, Harsh GR, Brown JM (2012) Inhibition of vasculogenesis, but not angiogenesis, prevents the recurrence of glioblastoma after irradiation in mice. J. Clin. Invest 120(3): 694-705.
- Wang SC, Yu CF, Hong JH, Tsai JS, Chiang CS (2013) Radiation therapyinduced tumor invasiveness is associated with SDF-1-regulated macrophage mobilization and vasculogenesis. PLoS One 8(8): e69182.
- Lu-Emerson C, et al. (2013) Increase in tumor-associated macrophages after ntiangiogenic therapy is associated with poor survival among patients with recurrent glioblastoma. Neuro-oncol 15(8): 1079–1087.
- Piao Y, et al. (2012) Glioblastoma resistance to anti-VEGF therapy is associated with myeloid cell infiltration, stem cell accumulation, and a mesenchymal phenotype. Neuro-oncol. 14(11): 1379–1392.
- Zhou J, Atsina KB, Himes BT, Strohbehn GW and Saltzman WM (2012) Novel Delivery Strategies for Glioblastoma, Cancer J. 18(1): 89-98 doi:10.1097/PPO.0b013e318244d8ae.
- Poli A, et al. (2013) Targeting glioblastoma with NK cells and mAb against NG2/CSPG4 prolongs animal survival.Oncotarget. 4(9): 1527–1546
- Frazier JL, et al. (2003) Local delivery of minocycline and systemic BCNU have synergistic activity in the treatment of intracranial glioma. J. Neurooncol. 64(3): 203–209.