In vivo Evaluation of a Novel Custom-Made press-Fit Dental Implant Through Electron Beam Melting®(EBM®)
Chu TG1*, Khouja N1, Chahine G2, Kovacevic R2, Koike M3, Okabe T4
1 Indiana University School of Dentistry, Indianapolis, IN, USA.
2 Department of Mechanical Engineering, Southern Methodist University, Dallas, TX, USA.
3 Department of Partial and Complete Denture, The Nippon Dental University, Tokyo, Japan.
4 Institute of Industrial Science, The University of Tokyo, Tokyo, Japan.
*Corresponding Author
Tien-Min G. Chu,
Indiana University School of Dentistry,
Department of Restorative Dentistry, 1121 W. Michigan St. Indianapolis, IN 46202, USA.
Tel: (317)-274-5148
E-mail: tgchu@iupui.edu
Received: November 05, 2016; Accepted: November 21, 2016; Published: November 22, 2016
Citation: Chu TG, Khouja N, Chahine G, Kovacevic R, Koike M, et al., (2016) In vivo Evaluation of a Novel Custom-Made press-Fit Dental Implant Through Electron Beam Melting® (EBM®). Int J Dentistry Oral Sci. 3(11), 358-365. doi: dx.doi.org/10.19070/2377-8075-1600073
Copyright: Chu TG© 2016. This is an open-access article distributed under the terms of the Creative Commons Attribution License, which permits unrestricted use, distribution and reproduction in any medium, provided the original author and source are credited.
Abstract
Recently, Electron Beam Melting (EBM® ) has been demonstrated as a novel manufacturing technique with high potential to fabricate custom-made press-fit dental implants. However, the biological performances of these implants have not been evaluated In vivo.
Purpose: The objective of this study was to evaluate and compare the In vivo performance of an EBM® press-fit dental implant to a commercially available press-fit dental implant (Endopore®).
Material and Methods: Endopore® implants (3.5 mm in diameter and 9 mm in length) and EBM® press-fit dental implants fabricated from Ti6Al4V ELI alloy powder and having the same overall geometry were tested. Specimens from each implant type (n=12/type) were placed in the tibia of six rabbits and retrieved after six weeks.
Results: Histological analyses showed osseointegration of the surrounding bone with both implant types. Both Endopore® and EBM® implants showed similar bone-to-implant contact (BIC) values of 35 ± 6% and 32 ± 9%, respectively. In push-out tests, no statistically significant differences were observed between the two groups in their peak push-out force and apparent shear stiffness (p > 0.05). However, SEM images and histology sections showed loose titanium beads in the EBM® group but not in the Endopore® group. The potential long-term impacts of these loose particles need further investigation.
2.Introduction
3.Materials and Methods
3.1.Implants
3.2.Surgical Procedure and Implant Insertion
3.3.Postsurgical Procedures
3.4.Specimen Retrieval and Histological Preparation
3.5.Histological and Histomorphometric Analysis
3.6.Push-Out Test
3.7.Statistical Analysis
4.Results
4.1.Implants
4.2.Clinical Observations
4.3.Histology
4.4.Bone-to-Implant Contact
4.5.Push-Out Test
5.Discussion
6.Conclusion
7.Acknowledgment
8.References
Keywords
Bone-Implant Interactions; Morphometric Analysis; Electron Beam Melting; Press-Fit; Dental Implants.
Introduction
Recently, a free-form fabrication method based on electron beam melting (EBM®) was demonstrated as a novel technique with high potential to fabricate custom-made press-fit dental implants [1]. Commercial electron beam melting machines developed by Arcam AB (EBM®, Mölndal, Sweden) employ a 4 kW electron beam gun to locally melt metal powder to particles ranging in size from 45 to 100 m and produce objects from the fused particles in a layer-by- layer pattern. Solid Ti6Al4V specimens made by EBM® have been shown to exhibit the same or higher value in yield strength, ultimate tensile strength, Rockwell hardness, elongation, fatigue strength and modulus elasticity when compared to ASTM F136 standard for wrought Ti6Al4V ELI alloy [2].
Customization is made possible by this computer-guided electron beam melting process to fabricate a metallic implant using a three-dimensional (3D) geometric information generated from tomography (CT) or computer aided design (CAD) software as the data source. Recently, several studies demonstrated the fabrication of computer-designed lattice structures from Ti6Al4V alloy on EBM® machines with the purpose to match the mechanical properties of bone and to facilitate tissue ingrowth. Using this, lattice structures with porosity in the range of 45% to 90% were made with a strut size ranging from 466-941 mm [1, 3-8], thus demonstrating the versatile manufacturing capability of this process. In 2008, Chahine et al. also demonstrated that EBM® can be used to make customized press-fit dental implants using the 3D computer file of a patient’s tooth obtained by computer tomography scanning [1].
Compared to the press-fit dental implants by EBM®, Endopore® (Innova Corp., Toronto, Canada), a popular press-fit commercial dental implant system, fabricates a porous surface on the implants by sintering Ti-6Al-4V particles of size 44-150 m to a solid titanium substrate at a high temperature under controlled atmosphere [9-11]. Through a solid-state diffusion process, particle-particle and particle-substrate junctions are formed to create a porous layer of about 0.3 mm thickness on the implant body [10, 12].
Many clinical studies have tested the Endopore® porous-coated press-fit implant system. High success rates were reported when these implants were used as short-term implants [10,11], as well as abutments for over dentures [9, 10, 12, 13]. In addition, they have been also used to replace missing teeth especially in narrow areas [14-18] such as those proximal to the maxillary sinus and at low bone levels [9, 16, 19-22].
Despite a number of clinical studies on the Endopore® press-fit implants, currently little is known about the In vivo performance of EBM® dental implants particularly in animal models. To address this deficit, in this study, we evaluated the In vivo performance of EBM® press-fit dental implants and compared to the commercially available porous-coated press-fit dental Endopore® implants using a rabbit tibial implantation model.
Materials and Methods
Twelve Endopore®™ (Innova Corp., Toronto, Canada) dental implants (3.5 mm in diameter and 9 mm in length) were used as controls. Twelve dental implants of the same overall geometry were made with the Ti6Al4V ELI (ASTM Grade 23, Arcam AB, Mölndal, Sweden) powder using the Electron Beam Melting machine (EBM® A2, Arcam®) at Southern Methodist University and used as the testing group [23]. Surface roughness numbers of the implants were measured on a contact profilometer (Surtronic 3+, Taylor Hobson Ltd, Leicester, UK). Each sample was scanned at three different locations with a sampling distance of 4 mm in each scan. In addition, one implant from each group was gold-coated and observed through a scanning electron microscope (SEM; JSM-5310LV, Jeol, Tokyo, Japan).
Six healthy male New Zealand white rabbits weighing between 3.0 and 3.5 kg were used. Implantation surgeries were carried out using a protocol approved by the Institutional Animal Care and Use Committee (IACUC) at Indiana University. NIH guidelines for the care and use of laboratory animals (NIH Publication #85-23 Rev. 1985) were stricktly observed. On the day of surgery, Meloxicam (0.2 mg/kg SC) was administrated as an analgesic drug 40-60 minutes before the procedure. The rabbits were then induced by injecting Acepromazine/Torbugesic (Ace 0.6mg/kg + Torb 0.75mg/kg) and maintained using Isoflurane (3.5% at 1.5 l/m) via gas masks. Baytril (4 mg/kg SC) was given as a prophylactic antibiotic. Following the onset of anesthesia, hair over both hind limbs was removed with electric clippers using #40 blades. Skin was disinfected with betadine and alcohol, and the rabbits were placed on a sterile cloth on top of a blanket in warm circulating water. The tibia was exposed and two holes spaced at a distance of 11 mm apart were drilled in the medial side of each tibia. The holes were drilled with a Ø 2.3 mm round bur, a Ø 2.5 mm pilot drill followed by a Ø 3.5 mm sizing bur at low drilling speeds under constant irrigation with copious saline solution. Each rabbit received two Endopore® implants in one tibia, and two EBM® implants in the other tibia. To contain the implants, they were carefully tapped in the prepared holes and the soft tissues were then closed in layers using 4-0 vicryl in a subcuticular pattern.
After surgery, the rabbits were allowed full weight-bearing activity and were checked daily until the surgical wound healed. Baytril (4 mg/kg SC) was administered once daily for 4 days and Meloxicam (0.2 mg/kg SC) was administered once daily for 2 days. To monitor the rate and extent of bone formation, calcein green at 10 mg/kg and alizarin red at 20 mg/kg were administered intramuscularly at 4 and 5 weeks post-implantation. At 6 weeks postimplantation, the rabbits were anaesthetized as described above and sacrificed with an overdose of pentobarbital.
The implants and surrounding tissue were harvested en bloc. To avoid variations arising from the differences in cortical thickness between distal and proximal osteotomy sites, all implants proximal to the patella were assigned for histomorphometric analysis and histological examination, while distally located implants were assigned for push-out analysis [24]. Twelve specimens (6 Endopore ® and 6 EBM® ) were used for histological analysis. The specimens were fixed for 48 h in 10% phosphate-buffered formaldehyde solution, followed by serial dehydration using 70% to 100% ethanol. Then, the specimens were embedded un-decalcified in PMMA. A series of approximately 8 sections, each 50 μm thick, were cut parallel to the long axis of the implant using a rotating microtome.
The histology slide containing the largest implant diameter from each series was stained with toluidine blue. The slides were photographed and then evaluated at 2.5X and 5X using an automated histomorphometry system (Bioquant, Nashville, TN) through a light microscope (Nikon Eclipse 50i, Tokyo, Japan) equipped with a charge-coupled distributor camera and connected to a computer (Dell Optiplex GX280, Round Rock, Texas, USA). Total implant perimeter in the cortical bone and implant length in direct contact with the bone were measured on the left and right sides of each histology section. Bone-to-implant contact (BIC) was obtained by dividing the total implant perimeter by the length in direct contact with the bone. Mean values and standard deviations were calculated for both implant groups. Fluorochrome analysis was performed under ultraviolet illumination using a fluorescence light microscope. Mineral apposition rate (MAR) was calculated by measuring the distance between the edges of two consecutive labels divided by the total number of days between injections. Measurements were made in three different areas: 1) bone ingrowth area within 1 mm of the implant, 2) periprosthetic bone area between 1 and 3 mm away from the implant and 3) the posterior tibial periosteum [25]. MAR was expressed in m/day [26].
To evaluate the mechanical properties of the implant-bone interface, a push out jig was constructed (Figure 1). Six specimens from each implant type previously stored in saline at 4°C were tested in a push-out test. Each specimen was placed on a support jig with clearance for the implant of at least 0.7 mm to minimize non-uniform stress distribution [27]. The specimen was seated on the support fixture and then loaded at a rate of 1 mm/min. Load was applied to the implant through a plunger connected to the crosshead of the material testing machine, and a forcedisplacement curve was recorded. The peak push-out force (F) was recorded in Newtons (N), the apparent shear stiffness (E) was obtained from the slope of the linear region of the loaddisplacement curve, and the energy to failure was obtained from the area under the curve [27].
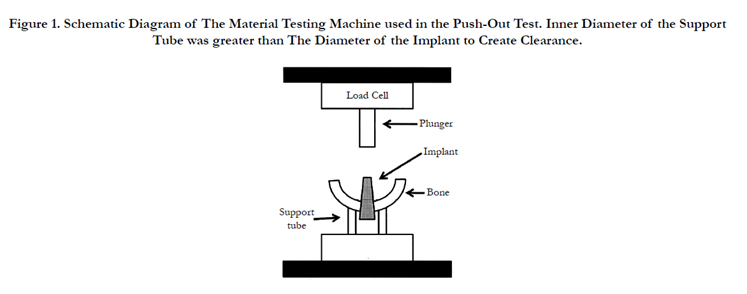
Figure 1. Schematic Diagram of The Material Testing Machine used in the Push-Out Test. Inner Diameter of the Support Tube was greater than The Diameter of the Implant to Create Clearance.
After the push-out test, one specimen from each group was examined under SEM. First, the lateral part of the tibia was fractured completely leaving only the medial half of the bone with the implant still attached. The implant and the fractured bone piece were sputter coated with gold and their interface was observed under SEM (JSM-5310LV, Jeol, Tokyo, Japan). One additional specimen from each group was then embedded un-decalcified in PMMA. Five 50 μm thick sections were cut parallel to the long axis of the implant using a rotating microtome and stained with toluidine blue.
Differences in BIC, peak push-out force, apparent shear stiffness, and MAR using linear mixed effects models were compared between the EBM® and Endopore® groups. Fixed effects for the left/right side and for each group were included in all analyses, and the MAR analyses included additional terms for location and group-by-location interaction. A single random effect from an animal was included in the peak load, stiffness and energy to yield analyses to account for the within-animal correlation between implants. In the BIC analyses, a second random effect was included to account for the two measurements made on each implant, and a third random effect was included in the MAR analyses to account for the locations around the implant.
Results
SEM images of the Endopore® implant surface (Figure 2) showed spherical beads ranging in size from 39-134 μm with an average bead size of 82 ± 26 μm. The EBM® dental implant surface appeared to have smaller beads ranging in size from 28-81 μm with an average bead size of 47 ± 12 μm. Moreover, beads in the EBM® implants appeared more rough and irregular than those in the Endopore ® implants. The measured surface roughness numbers are listed in Table 1. Statistical differences were not observed for Ra and Rq, while the differences in Rz measurements were statistically significant among the two implants (Table 1).
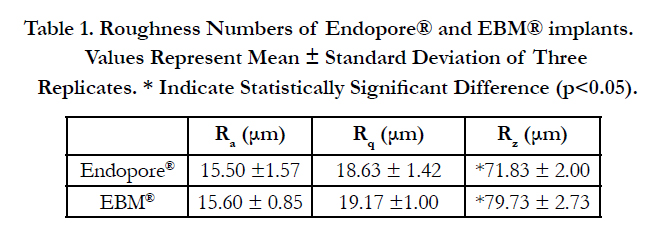

Table 1. Roughness Numbers of Endopore® and EBM® implants. Values Represent Mean ± Standard Deviation of Three Replicates. * Indicate Statistically Significant Difference (p<0.05).
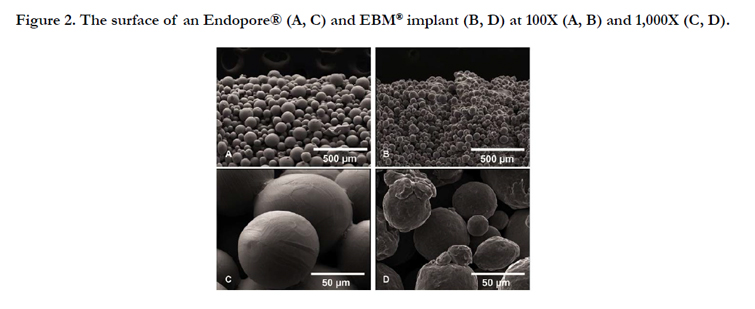
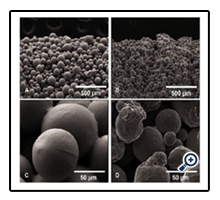
Figure 2. The surface of an Endopore® (A, C) and EBM® implant (B, D) at 100X (A, B) and 1,000X (C, D).
After surgery, the rabbits did not exhibit complications throughout the 6-week experimental period. At retrieval, none of the rabbits showed clinical signs of mobility or inflammation. In radiographic and clinical aspects, all implants appeared to have osseointegrated.
Light microscopic observation of the sections in both EBM® and Endopore® implant groups revealed periosteal and endosteal callus in close proximity to the implants. Signs of inflammation or soft tissue encapsulation were not observed around the implants (Figure 3A and 3B). A clear demarcation was noted between the original cortical bone and the new bone growing in between the beads. The original cortical bone was clearly defined by its compact, lamellar appearance and by the presence of osteons, whereas the bone growing between the implant and the original cortical bone appeared to be less organized, less lamellar and consistent with woven bone. Under fluorescence microscope, active bone formation was observed in the periosteal callus area mostly by calcein staining. Bone apposition was also observed along the periosteum and endosteum. MAR was calculated in three different areas in both the EBM® and Endopore® samples to measure the rate of new bone formation. The results showed no significant difference between the two implants or among the three locations (Table 2).
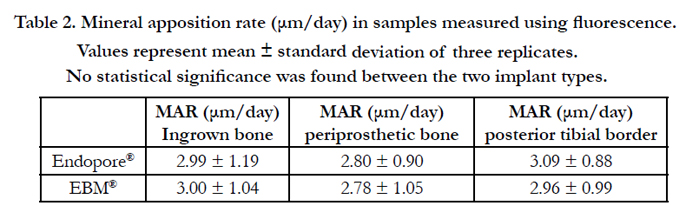
Table 2. Mineral apposition rate (μm/day) in samples measured using fluorescence. Values represent mean ± standard deviation of three replicates. No statistical significance was found between the two implant types.
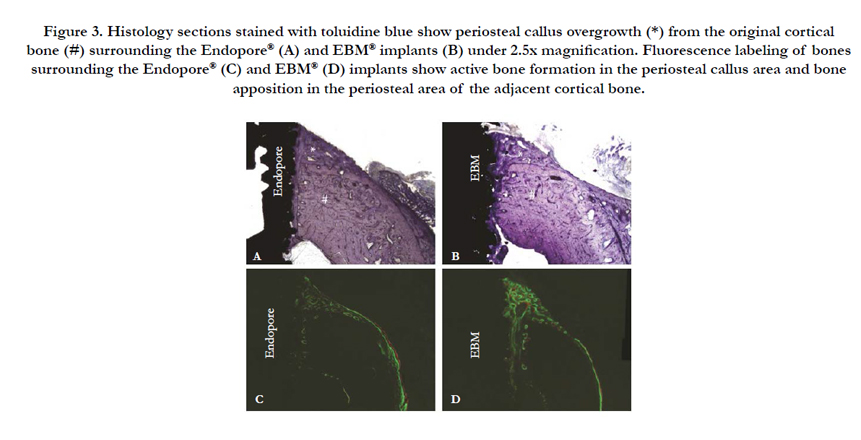
Figure 3. Histology sections stained with toluidine blue show periosteal callus overgrowth (*) from the original cortical bone (#) surrounding the Endopore® (A) and EBM® implants (B) under 2.5x magnification. Fluorescence labeling of bones surrounding the Endopore® (C) and EBM® (D) implants show active bone formation in the periosteal callus area and bone apposition in the periosteal area of the adjacent cortical bone.
At a higher magnification (5X), the thickness of the porous coating on Endopore® was estimated to be ~250 m. In the EBM® samples, some areas on the side of the implant had a classical “stair-step” feature built in a layer-by-layer fashion in the form of scalloping. Based on the shape of the scalloping and the long axis of the implant, the orientation of the newly built layer could be drawn as shown in the dashed line in Figure 4B. The built layer thickness was estimated to be ~180 m. Some areas of bone resorption followed by new bone formation were seen next to the Endopore® implants (Figure 4C). The resorption is likely due to the close proximity of the implant beads to the original bone. In the EBM® implants, loose metal beads were observed in the tissue. It was unclear if the beads were transported to the tissue during implantation or during histological sample preparation. Furthermore, bone growth was also observed in the porous space between the beads in both implants (Figure 4C and 4D).
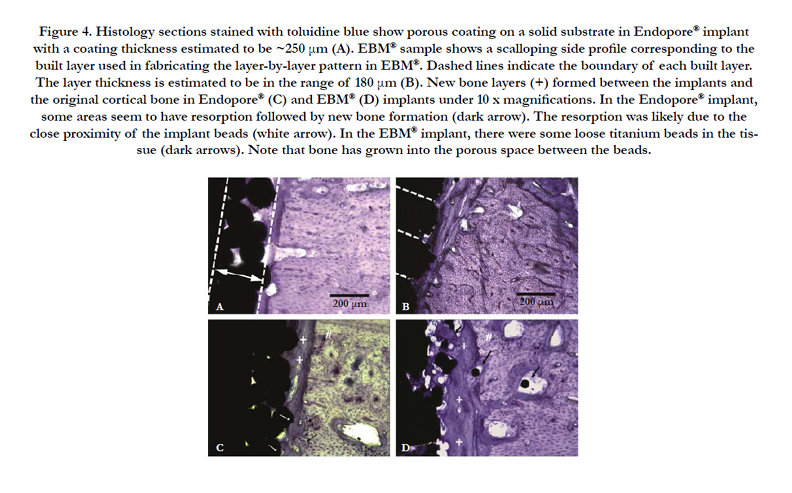
Figure 4. Histology sections stained with toluidine blue show porous coating on a solid substrate in Endopore® implant with a coating thickness estimated to be ~250 μm (A). EBM® sample shows a scalloping side profile corresponding to the built layer used in fabricating the layer-by-layer pattern in EBM®. Dashed lines indicate the boundary of each built layer. The layer thickness is estimated to be in the range of 180 μm (B). New bone layers (+) formed between the implants and the original cortical bone in Endopore® (C) and EBM® (D) implants under 10 x magnifications. In the Endopore® implant, some areas seem to have resorption followed by new bone formation (dark arrow). The resorption was likely due to the close proximity of the implant beads (white arrow). In the EBM® implant, there were some loose titanium beads in the tissue (dark arrows). Note that bone has grown into the porous space between the beads.
A comparison of the bone-to-implant contact (BIC) between the Endopore® and the EBM® implants demonstrated similar results with no significant difference (p > 0.05). Mean BIC for the Endopore ® implant was approximately 35% ± 6% while the mean BIC for the EBM® implant was 32% ± 9%.
A typical load-displacement curve of the test sample is shown in Figure 5B. The peak push-out force for Endopore® implants ranged from 112.0-420.5 N with an average of 235.75 ± 105.80 N. The peak push-out force for EBM® implants ranged from 188-379 N with an average of 243.21 ± 69.75 N (Figure 5C). The apparent shear stiffness of the bone-implant interface for the Endopore® implants ranged from 366-702 N/mm with an average of 598.13 ± 126.91 N.
The apparent shear stiffness for EBM® implants ranged from 352- 782 N/mm with an average of 584.48 ± 146.63 N (Figure 5D). The average energy to failure was 79±58.99 N-mm and 91.86 ± 58.13 N-mm for the Endopore® and EBM® implants, respectively. However, there was no statistical difference in the peak pushout force, apparent shear stiffness and energy to failure between the two groups.
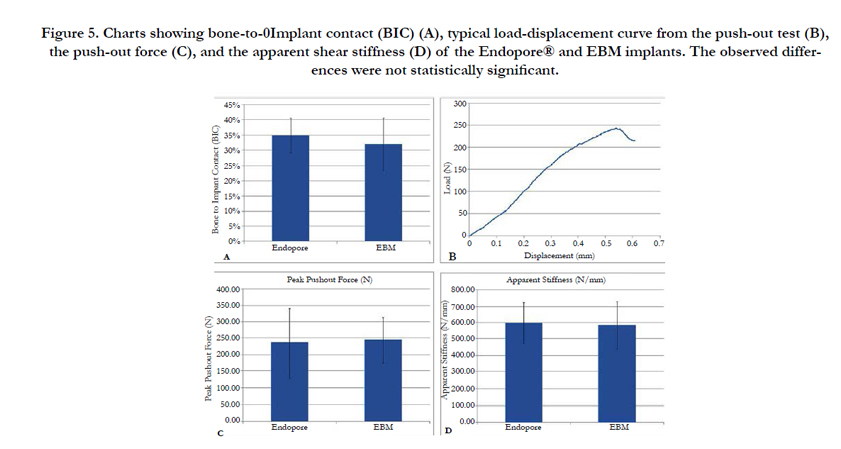
Figure 5. Charts showing bone-to-0Implant contact (BIC) (A), typical load-displacement curve from the push-out test (B), the push-out force (C), and the apparent shear stiffness (D) of the Endopore® and EBM implants. The observed differences were not statistically significant.
In SEM analyses, the Endopore® implant surfaces showed attachment of parts of the bone to the implant beads (Figure 6B). On the opposing bone surface was a replica of the implant beads showing a clear image of intimate bone growth around the spherical titanium beads (Figure 6A). SEM images of the EBM® implant surfaces showed smooth areas where the beads had pulled away during bone fracture. Areas of bone attachment between the beads were also evident (Figure 7B). On the opposing bone surface to the EBM® implants, many implant beads remained on the bone surface (Figure 7A). In an enlarged image, the point of attachment of the titanium bead to the original implant was visible (Figure 7C). A histological image of an EBM® push-out specimen showed the pushing direction used in the push-out test and the corresponding position between the bone and the implant (Figure 7D).
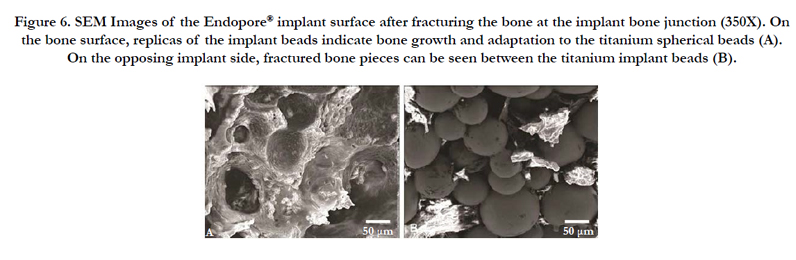
Figure 6. SEM Images of the Endopore® implant surface after fracturing the bone at the implant bone junction (350X). On the bone surface, replicas of the implant beads indicate bone growth and adaptation to the titanium spherical beads (A). On the opposing implant side, fractured bone pieces can be seen between the titanium implant beads (B).
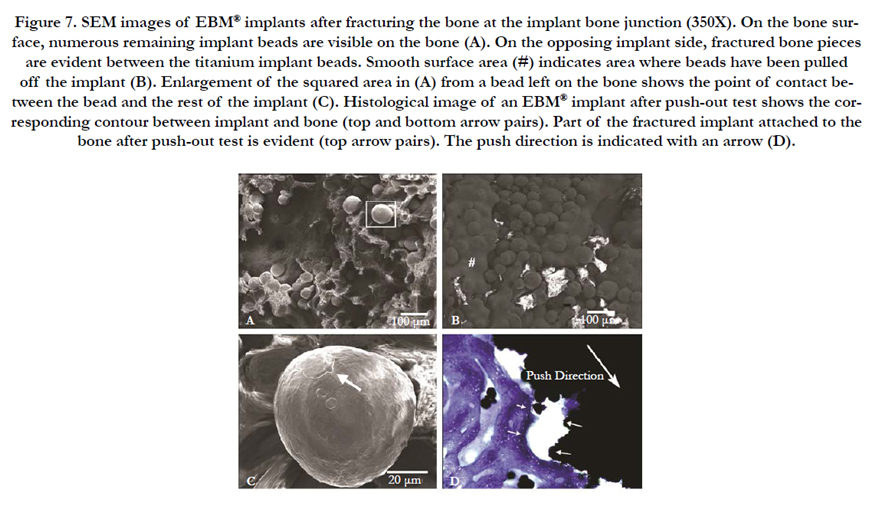
Figure 7. SEM images of EBM® implants after fracturing the bone at the implant bone junction (350X). On the bone surface, numerous remaining implant beads are visible on the bone (A). On the opposing implant side, fractured bone pieces are evident between the titanium implant beads. Smooth surface area (#) indicates area where beads have been pulled off the implant (B). Enlargement of the squared area in (A) from a bead left on the bone shows the point of contact between the bead and the rest of the implant (C). Histological image of an EBM® implant after push-out test shows the corresponding contour between implant and bone (top and bottom arrow pairs). Part of the fractured implant attached to the bone after push-out test is evident (top arrow pairs). The push direction is indicated with an arrow (D).
Discussion
In this study, we investigated the In vivo performance of custommade press-fit dental implants fabricated with EBM® and compared it to the commercial press-fit implant, the Endopore®. Our analyses showed that both implant types had osseointegration around the bone, and similar bone-to-implant contact (BIC) values, peak push-out force and apparent shear stiffness. These findings are significant because studies on the In vivo performance of EBM® dental implants are limited. Indeed, the In vivo characterization of even the commercial press-fit implant, Endopore®, using animal model is scarce. This is the first comparative study to analyze the two implant systems using both histomorphometry and push-out tests.
In a previous animal study, Rahmani et al. observed a BIC value of 22.8% ± 10.8 for the custom-made Endopore® implants (3 mm in length and 2 mm in diameter) in the maxilla of 28 rabbits at 8 weeks after implantation [22]. On the other hand, Ponader et al. measured BIC in compact and porous Ti6Al4V cylinders (8 mm long, 4mm diameter) fabricated using the EBM® S12 system (Arcam AB, Mölndal, Sweden) and placed in skull defects of pigs. BIC around the EBM® implants was 0.47% on day 14 but increased to 5.96% on day 60. The authors attributed the low BIC values to the micromovements in the implant that likely hindered bone formation [28]. Another study placed EBM® implants (3.75 mm in diameter and 4 mm in length) in rabbit tibia for 2 weeks and obtained a BIC value of 31±3% [2]. In our study, we obtained similar BIC values of 35% ± 6% and 32% ± 9% for Endopore® and EBM® implants, respectively. It should be noted that qualitative differences (loose particles) between the two implants were however, observed in SEM and histological sections.
Our findings showed that Endopore® implants consist of a 2-3 layers of regular-shaped beads attached to the solid substrate (Figures 2, 3, and 4). EBM® implants, on the other hand, were entirely made of regularly arranged titanium beads in a bead-by-bead, and layer-by-layer pattern. Occasionally, edges of the consecutive layers used to build the EBM® implants were noticeable on the histology slides. The surface texture of EBM® implants therefore comes from two topology levels: 1) from the edges of the built layers, as shown in the scalloping outline in Figure 4B, and 2) from the adherent beads. This dual-level topology could have likely contributed to the observed difference in Rz, which measures the height between the largest peak and valley.
In both implant types, the porous space between the beads provides space for bone ingrowth and allows for the formation of an interlocking structure between the newly formed bone and beads. This was confirmed by the histological as well as the SEM analyses in this study. However, after the push-out test we observed many loose titanium particles remaining on the bone in the SEM of EBM® samples, while no remnant beads were seen in the bones next to the Endopore® implants. These loose particle could likely result from the weaker bonding between particles and/or improved bonding of particles with the bone. However, the actual reason for the presence of loose titanium particles in EBM® samples needs further investigation. This observation raises a concern on the use of EMB® implant, which may result in loose particles and increase the probability of implant detachment when subjected to occlusal loading. Also, whether the dislodged particles would become an issue in the long-term should to be investigated.
Push-out tests are regularly used to evaluate the mechanical proficiency of orthopedic implant attachment by measuring the shear strength of the bone-implant interface. The test measures the force (or stress, where defined interfacial area can be measured) required to displace the implant from the surrounding tissue. The apparent shear stiffness is obtained from the load-displacement curve. For example, Deglurkar et al., measured the stiffness of porous tantalum implants (Trabecular Metal) inserted in the distal femur of rabbits in three different experimental groups [29]. Jakobsen et al. measured the shear stiffness in cylindrical porous bead- coated implants (Ti-6Al-4V, ASTM F-136) (diameter of 6.0 mm and length of 10.0 mm) placed proximal to the dog humerus [30]. Another study by Friedman et al., where the experimental design was similar to our study, used implants (8 mm in height and 5.5 mm in diameter) coated with Cr/Co beads in rabbit femurs [31]. They recorded a push-out shear strength of 6 MPa after 6 weeks. Thus far, Endopore® dental implants have not been evaluated by a push-out test. In our study, both EBM® and Endopore® implants showed similar push-out force and shear stiffness indicating a similar ability to resist the dislodging force.
Mineral apposition rate (MAR) has been used to measure the rate of new bone apposition around the implant during the healing period. For example, Wang et al. measured MAR in bioceramiccoated titanium implants after placement in cortical and corticocancellous bone of sheep femur for 6 weeks and injecting the fluorochromes, calcein and alizarin complexone [32]. Similarly, Foley et al. measured MAR around acid etched titanium implants inserted in the mandible of foxhounds [33]. It appears that MAR could be affected by the implant material. Witte et al. measured MAR around the open-porous magnesium alloy scaffolds placed in rabbit knee condyle for 3 and 6 months, and compared it to an autologous bone transplant in the opposite side [34]. They found that the control (autologous transplant) side had a lower MAR (1.8 ± 0.2 m/day) compared to a higher MAR (2.4 ± 0.4 m/day) on the magnesium scaffold side after 3 months. Loading has been also show to affect MAR. Clark et al., found that the average MAR of mechanically loaded screw-type titanium implants was significantly greater (3.8 ± 1.2 μm/day) than the average MAR of unloaded controls (2.2 ± 0.92 μm/day) (P<0.01) [35].
Finally, the surface topology of porous-coated implants can also impact MAR. Willie et al. implanted three types of porous-coated implants (beaded, large pore foam and small pore foam) in rabbit knees. MAR of bone ingrowth was higher in large pore foam and small pore foam when compared to the beaded surface at 6 weeks [25]. Our MAR values from this study are also in a similar range for both implant types. These results suggest that the two types of beaded surfaces are not distinct enough to cause a difference in MAR.
Conclusions
Custom-made press-fit dental implants fabricated by EBM® showed bone responses similar to the Endopore® implants in terms of bone-to-implant contact, bone mineral apposition rate, push-out force and apparent shear stiffness in a rabbit tibial implantation model. However, loose particles observed on the bones proximal to the EBM® implants in the histological sections and SEM micrographs raise concerns on the likely detachment of the titanium particle from the implants when subjected to loading.
Acknowledgment
This project was funded by the Baylor College of Dentistry, Texas A&M University.
References
- Chahine G, Koike M, Okabe T, Smith P, Kovacevic R (2008) The design and production of Ti- 6Al-4V ELI customized dental implants. JOM. 60(11): 50-55.
- Thomsen P, Malmstrom J, Emanuelsson L, Rene M, Snis A (2009) Electron beam-melted, free-form-fabricated titanium alloy implants: Material surface characterization and early bone response in rabbits. J Biomed Mater Res B Appl Biomater. 90(1): 35- 44.
- Harrysson OLA, CansiZoglu O, Marcellin-Little DJ, Cormier DR, West HA (2008) Direct metal fabrication of titanium implants with tailored materials and mechanical properties using electron beam melting technology. Mater Sci Eng C- Biomimetic and Supramolecular Systems. 28(3): 366-373.
- Heinl P, Korner C, Singer RF (2008) Selective Electron Beam Melting of Cellular Titanium: Mechanical Properties. Adv Eng Mater. 10(9): 882-888.
- Heinl P, Muller L, Korner C, Singer RF, Muller FA (2008) Cellular Ti-6Al4V structures with interconnected macro porosity for bone implants fabricated by selective electron beam melting. Acta Biomater. 4(5): 1536-1544.
- Li X, Wang CT, Zhang WG, Li YC (2009) Properties of a porous Ti-6Al-4V implant with a low stiffness for biomedical application. Proc Inst Mech Eng H. 223(2): 173-178.
- Li X, Wang CT, Zhang WG, Li YC (2009) Fabrication and characterization of porous Ti6Al4V parts for biomedical applications using electron beam melting process. Materials Letters. 63(3-4): 403-405.
- Parthasarathy J, Starly B, Raman S, Christensen A (2010) Mechanical evaluation of porous titanium (Ti6Al4V) structures with electron beam melting (EBM®). J Mech Behav Biomed Mater. 3(3): 249-59.
- Fleming AE (1994) The Endopore dental implant system: implant treatment simplified. J Can Dent Assoc. 60(9): 785-789.
- Pilliar RM, Deporter DA, Watson PA, Todescan R (1998) The Endopore implant-enhanced osseointegration with a sintered porous-surfaced design. Oral Health. 88(7): 61-64.
- Stanford CM (2009) Surface modifications of dental implants. Aust Dent J. 53(1): S26-33.
- Deporter D, Watson P, Pharoah M, Todescan R, Tomlinson G (2002) Tenyear results of a prospective study using porous-surfaced dental implants and a mandibular overdenture. Clin Implant Dent Relat Res. 4(4): 183-189.
- Pilliar RM, Deporter DA, Watson PA, Valiquette N (1991) Dental implant design--effect on bone remodeling. J Biomed Mater Res. 25(4): 467-483.
- Deporter D, Ogiso B, Sohn DS, Ruljancich K, Pharoah M (2008) Ultrashort sintered porous- surfaced dental implants used to replace posterior teeth. J Periodontol. 79(7): 1280-1286.
- Deporter D, Pilliar RM, Todescan R, Watson P, Pharoah M (2001) Managing the posterior mandible of partially edentulous patients with short, porous-surfaced dental implants: early data from a clinical trial. Int J Oral Maxillofac Implants. 16(5): 653-658.
- Deporter DA, Todescan R, Watson PA, Pharoah M, Levy D, et al., (1998) Use of the Endopore dental implant to restore single teeth in the maxilla: protocol and early results. Int J Oral Maxillofac Implants. 13(2): 263-272.
- Deporter DA, Todescan R, Watson PA, Pharoah M, Pilliar RM,et al., (2001) A prospective human clinical trial of Endopore dental implants in restoring the partially edentulous maxilla using fixed prostheses. Int J Oral Maxillofac Implants. 16(4): 527-536.
- Hagi D, Deporter DA, Pilliar RM, Arenovich T (2004) A targeted review of study outcomes with short (< or = 7 mm) endosseous dental implants placed in partially edentulous patients. J Periodontol. 75(6): 798-804.
- Deporter D, Todescan R, Caudry S (2000) Simplifying management of the posterior maxilla using short, porous-surfaced dental implants and simultaneous indirect sinus elevation. Int J Periodontics Restorative Dent. 20(5):476-485.
- Deporter DA, Caudry S, Kermalli J, Adegbembo A (2005) Further data on the predictability of the indirect sinus elevation procedure used with short, sintered, porous-surfaced dental implants. Int J Periodontics Restorative Dent. 25(6): 585-593.
- Heller AL, Heller RL (1996) Clinical evaluations of a porous-surfaced endosseous implant system. J Oral Implantol. 22(3-4): 240-246.
- Rahmani M, Shimada E, Rokni S, Deporter DA, Adegbembo AO, et al., (2005) Osteotome sinus elevation and simultaneous placement of poroussurfaced dental implants: a morphometric study in rabbits. Clin Oral Implants Res 16(6): 692-699.
- Koike M, Martinez K, Guo L, Chahine G, Kovacevic R, et al., (2011)Evaluation of titanium alloy fabricated using electron beam melting system for dental applications. J Mater Proc Techn. 211(8): 1400-1408.
- Shin D, Blanchard SB, Ito M, Chu TM (2011) Peripheral quantitative computer tomographic, histomorphometric, and removal torque analyses of two different non-coated implants in a rabbit model. Clin Oral Implants Res. 22(3): 242-250.
- Willie BM, Yang X, Kelly NH, Merkow J, Gagne S, et al., (2010) Osseointegration into a novel titanium foam implant in the distal femur of a rabbit.J Biomed Mater Res B Appl Biomater. 92(2): 479-488.
- Parfitt AM, Drezner MK, Glorieux FH, Kanis JA, Malluche H, et al., (1987) Bone histomorphometry: standardization of nomenclature, symbols, and units. Report of the ASBMR Histomorphometry Nomenclature Committee.J Bone Miner Res. 2(6): 595-610.
- Berzins A, Sumner DR (2000) Implant Pushout and Pullout Tests : Mechanical testing of bone and the bone-implant interface. Boca Raton, FL, CRC Press. 463-476.
- Ponader S, von Wilmowsky C, Widenmayer M, Lutz R, Heinl P, et al., (2009) In vivo performance of selective electron beam- melted Ti-6Al-4V structures. J Biomed Mater Res A. 92(1): 56-62.
- Deglurkar M, Davy DT, Stewart M, Goldberg VM, Welter JF (2007) Evaluation of machining methods for trabecular metal implants in a rabbit intramedullary osseointegration model. J Biomed Mater Res B Appl Biomater.80(2): 528-540.
- Jakobsen SS, Baas J, Jakobsen T, Soballe K (2010) Biomechanical implant fixation of CoCrMo coating inferior to titanium coating in a canine implant model. J Biomed Mater Res A. 94(1): 180-186.
- Friedman RJ, An YH, Ming J, Draughn RA, Bauer TW (1996) Influence of biomaterial surface texture on bone ingrowth in the rabbit femur. J Orthop Res. 14(3): 455-464.
- Wang C, Karlis GA, Anderson GI, Dunstan CR, Carbone A, et al., (2009) Bone growth is enhanced by novel bioceramic coatings on Ti alloy implants. J Biomed Mater Res A. 90(2): 419-428.
- Foley CH, Kerns DG, Hallmon WW, Rivera-Hidalgo F, Nelson CJ, et al., (2010) Effect of phosphate treatment of Acid-etched implants on mineral apposition rates near implants in a dog model. Int J Oral Maxillofac Implants.25(2): 278-286.
- Witte F, Ulrich H, Palm C, Willbold E (2007) Biodegradable magnesium scaffolds: Part II: peri-implant bone remodeling. J Biomed Mater Res A. 81(3): 757-765.
- Clark PA, Rodriguez A, Sumner DR, Hussain MA, Mao JJ (2005) Modulation of bone ingrowth of rabbit femur titanium implants by In vivo axial micromechanical loading. J Appl Physiol. 98(5): 1922-1929.