A Non-Invasive Glucose Estimation in Saliva Samples by using Pre Column Derivatised RP-HPLC
K. Sirisha1, D. Ashok1, T. Kishore Babu1, P. V Suresh1*, A.E Prabhahar1, Rama Rao N1
1 Department of Pharmaceutical Analysis, Chalapathi Institute of Pharmaceutical Sciences, Lam, Guntur, AP, India.
*Corresponding Author
P.V Suresh,
Department of Pharmaceutical Analysis,
Chalapathi Institute of Pharmaceutical Sciences,
Lam, Guntur, AP, India.
E-mail: sureshpharma78@gmail.com
Received: August 20, 2015; Accepted: January 27, 2016; Published: January 30, 2016
Citation: P. V Suresh et al., (2016) A Non-Invasive Glucose Estimation in Saliva Samples by using Pre Column Derivatised RP-HPLC. Int J Diabetol Vasc Dis Res,. 4(1), 146-151.DOI : dx.doi.org/10.19070/2328-353X-1600031
Copyright: P. V Suresh© 2016. This is an open-access article distributed under the terms of the Creative Commons Attribution License, which permits unrestricted use, distribution and reproduction in any medium, provided the original author and source are credited.
Abstract
Diagnostic devices available in the market to measure blood glucose level which requires blood as diagnostic body fluid. Hence, necessity arises to find some non-invasive diagnostic mean to measure body glucose level frequently without any discomfort to the patient. The present study was aimed at estimation of blood and salivary glucose level in diabetic and non diabetic subjects. Saliva is one of the most abundant secretions in the human body and its collection is easy and noninvasive. The aim of this study was to find a medium that can be used to diagnose and monitor diabetes. In this, saliva could play a major role. To explain the role of saliva as a diagnostic tool, saliva samples were compared with blood glucose in healthy and diabetic subjects.
50 subjects were included in this study. The subjects were asked to come to the clinic in the early morning and after 2 hours fast. At that time, 5 mL of venous blood was collected in an ethylene diamine tetra acetic acid (EDTA)-containing blood collection tube for estimation. Unstimulated saliva was collected from subjects. The saliva and plasma from the blood samples were subjected to glucose estimation by pre-derivatised RP-HPLC method. A correlation was observed between FSG and FPG of diabetic as well as non diabetic subjects. The correlation coefficients for non-diabetic and diabetic subjects were 0.9967, proving the correlation between fasting saliva glucose and fasting blood glucose values statistically. Values observed regarding blood and saliva glucose level were found distinctly different between normal and diabetic subjects suggesting that monitoring of saliva glucose level can be used as an index of diabetes mellitus.
2.Introduction
3.Materials and Methods
3.1.Instrumentation
3.2.Chemicals
3.3.Chromatographic conditions
3.4.Sample Extraction and Cleanup Procedure
3.5.Selectivity
3.6.Linearity
3.7.Source of data
3.8.Method of collection of data
3.9.Blood sample collection
3.10.Unstimulated Salivary Sample Collection
4.Results and Discussion
5.Conculsion
6.Acknowledgement
7.References
Key Words
Saliva; Salivary Glucose; Serum Glucose; Insulin; Hyperglycemia.
Introduction
Diabetes is characterized by polyurea, polydypsia and weight loss in spite of polyphagia, hyperglycemia, glucosuria, ketosis, and acidosis and coma. The cause of clinical diabetes is always due to deficiency of the effects of insulin at the tissue level, but the deficiency may be relative. One of the common forms Type-1 (Insulin Dependent Diabetes Mellitus IDDM) is due to insulin deficiency caused by auto-immune destruction of β-cells in pancreatic islets, the A, D and F cells remain intact. Type 1 diabetes usually develops before the age of 40 and hence called juvenile diabetes [1-3].
The other variant Type-2 diabetes mellitus insulin secretion, insulin resistance in muscle, liver and adipocytes and abnormalities in splanchnic glucose uptake. Diabetes is sometimes complicated by acidosis and in long standing diabetes are additional complications which include micro vascular, macro vascular and neuropathic diseases. Despite the tremendous value of self monitoring of blood glucose for the treatment of diabetes, many patients find the testing onerous and some refuse to perform the measurement. These complaints are largely justified because self monitoring of blood glucose is painful, inconvenient, messy, embarrassing and above all expensive.
Non invasive monitoring of glucose has been of particular interest because of the pain associated with invasive self monitoring. Ease of use and reduction of pain can encourage more frequent testing and hence tighter control of the glucose concentration. Diagnostic tests based on fluid generally use blood and urine and less frequently the esoteric fluids such as saliva, sweat and tears [4-7].
Saliva offers distinctive advantages over serum because it can be collected non-invasively by individuals with modest training. Furthermore saliva may provide a cost effective approach for the screening of large populations. Despite few limitations, the use of saliva for diagnostic purposes is increasing in popularity due to its many potential advantages. It provides an attractive alternative to more invasive, time consuming, complicated glucose monitoring tests as saliva can be collected in a non invasive manner by individuals with modest training including patients. Saliva has been used reliably for reflecting and monitoring the blood glucose concentration in the patients of diabetes mellitus [8-11].
Hence the present study was undertaken to quantitatively estimate the amount of salivary glucose levels in Type-2 diabetic patients and explore the possibility of using saliva to reflect the glucose concentration in blood, thereby making self-measurement of glucose less invasive.
Materials and Methods
Method development and validation was performed on Phenomax-C18 (250 x 4.6 mm, 3.5µ) column. The HPLC system includes HPLC pump (Agilent 1200 Infinity series) and UV detector (Agilent 1200 Infinity series). The software used was Ezichrome Elite Compact.
D-Glucose HPLC (Merck India), PABA AR (Merck India), Sodium Acetate (AR Loba chemie), Acetonitrile (HPLC Merck India), Water HPLC (Merck India), Diethyl Ether AR (Merck India), Blank Human Plasma Charcoal treated (Navjeevan Blood bank).
Chromatographic separation was achieved with 50mM Sodium acetate: Acetonitrile as mobile phase and baseline noise was observed using the Phenomax-C18 (250 x 4.6 mm, 3.5µ) column with run time of 5 min at a flow rate of 1.0mL/min. The temperature of the column oven set to ambient temperature. Sample volume for injection into HPLC was adjusted to 20 μL for better chromatography. The retention time of iron eluted at 3.4 ± 0.02 min.
To each labelled polypropylene tube 2.5 mL of diethyl ether was added containing 100 µL of saliva/plasma sample and vortexed for 15 min. The samples were centrifuged at 4000 rpm for 15 min at ambient temperature. The supernant phase was transferred to a clean PP tube and dried with nitrogen gas at 40°C up to 20 min. The residue was reconstituted with 0.2ml of 0.2% w/v PABA reagent and 500 μL mobilephase. The mixture was heated at 70°C for 30 min, cooled the sample and 20 µL sample was injected into HPLC.
Selectivity was performed by analyzing the six different charcoal treated human saliva blank samples to test for interference at the retention time of analyte and confirming that interference does not affect the quantification at LLOQ level. The blank chromatogram was depicted in Figure 1.
Charcoal treated human saliva was screened prior to spiking to ensure it was free from endogenous interference at retention time of analyte. Calibration standards were prepared by spiking in charcoal treated human saliva to obtain linearity range of 40.00, 60.00, 80.00, 100.00, 200.00, 400.00, 600.00 µg/mL.
Included in the study were 50 volunteers (males and females) group who were newly diagnosed with Type-2 diabetes and attending the clinic. The patients were grouped into five age groups: ≤30 in group-1, 31-40 in group-2, 41-50 in group-3, 51-60 in group-4, >60 in group-5.
An informed consent was obtained from all the patients along with the explanation of the procedure to be performed. Subjects currently with any systemic diseases or with tobacco or alcohol habits were excluded from the study. Written consent was obtained from each individual taking part in the study and a data sheet was completed detailing the person’s name, age, sex and relevant medical history.
The subjects were asked to come into the clinic in the early morning with empty stomach and after 2 hours after breakfast blood were collected in an ethylene diamine tetra acetic acid (EDTA) collection tube. The blood samples were centrifuged and glucosewas estimated in the plasma samples by the spectrophotometric method.
Salivary sample collections were collected in the clinic laboratory in the early morning on 6-7am with an empty stomach and after 2 hours of breakfast subjects were asked to wash their mouths with distilled water and to spit two or three times in wash sink, after which they were told to spit the saliva pooled in their mouths for the following 5 minutes into the sterile sample collection container saliva and samples were centrifuged and glucose was estimated in the supernatant saliva by the glucose pre column derivative RPHPLC method. The study was conducted during the period of January 2015 to April 2015.
Statistical analysis of the obtained data was conducted using ORIGION statistical software version 2007.1. Means and standard deviations of individual groups were calculated. These were then compared using independent Student’s t-test, Fisher’s test and regression.
Results and Discussion
The developed method shows less matrix effect at analyte retention time. The chromatograms of blank and saliva sample were depicted in Figure 1&2.
Comparisons of salivary glucose levels between the control and patient groups were performed with a t-test and the difference was found to be less significant (P>0.05). The results were depicted in Table 1 to 6.
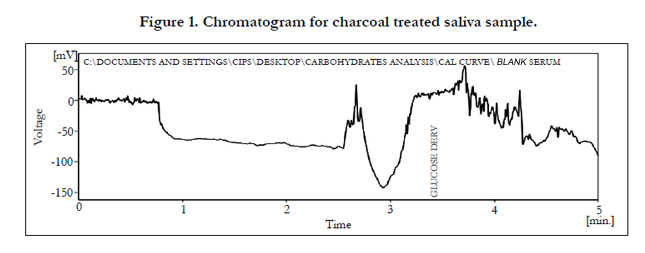
Figure 1. Chromatogram for charcoal treated saliva sample.
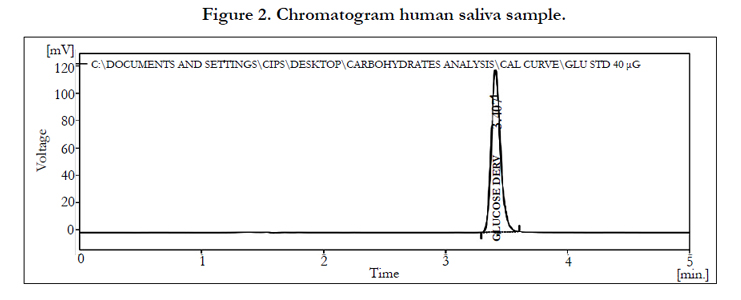
Figure 2. Chromatogram human saliva sample.
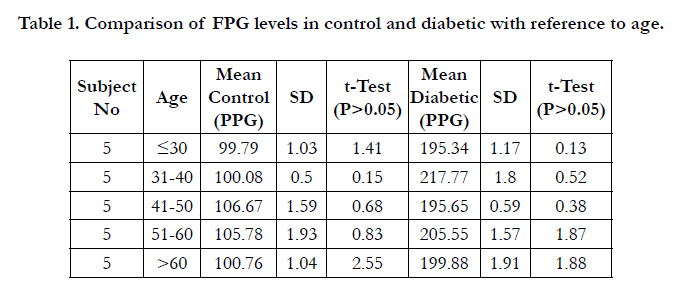

Table 1. Comparison of FPG levels in control and diabetic with reference to age.
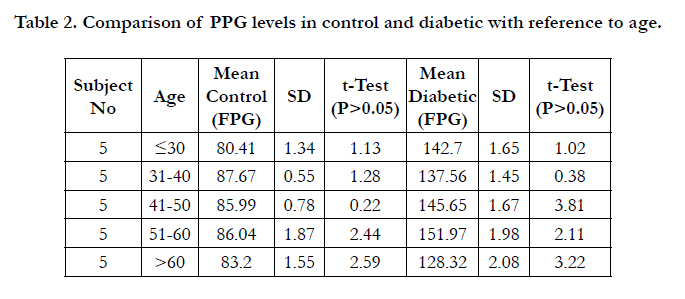
Table 2. Comparison of PPG levels in control and diabetic with reference to age.
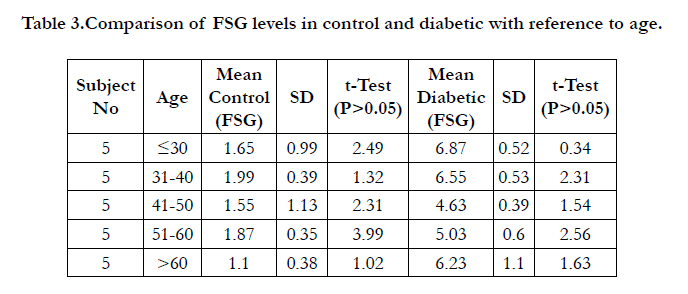
Table 3.Comparison of FSG levels in control and diabetic with reference to age.
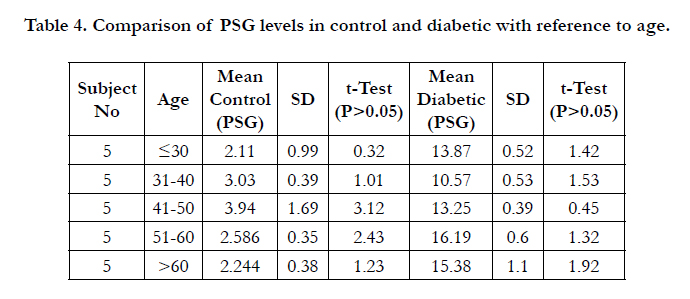
Table 4. Comparison of PSG levels in control and diabetic with reference to age.
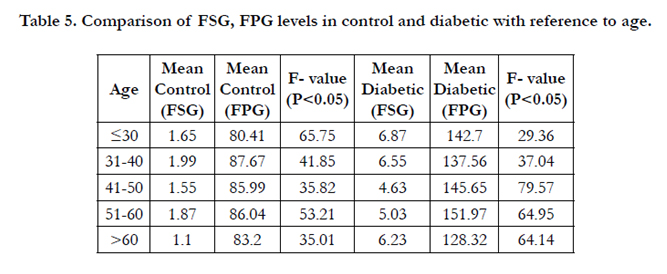
Table 5. Comparison of FSG, FPG levels in control and diabetic with reference to age.
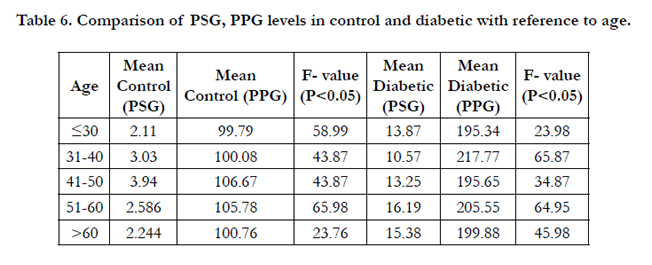
Table 6. Comparison of PSG, PPG levels in control and diabetic with reference to age.
In the control group during fasting and postprandial state the mean plasma glucose levels ranged from 80.41 to 87.67 mg/dl, 99.79 to 106.67 mg/dl and mean salivary glucose levels ranged from 1.10 to 2.99 mg/dl, 4.63 to 6.87 mg/dl. The correlation coefficient between fasting and post prandial glucose levels of saliva Vs plasma was calculated and the r-value was found to be 0.931 and 0.990. The results were depicted in Figure 3&4 and Table 7.
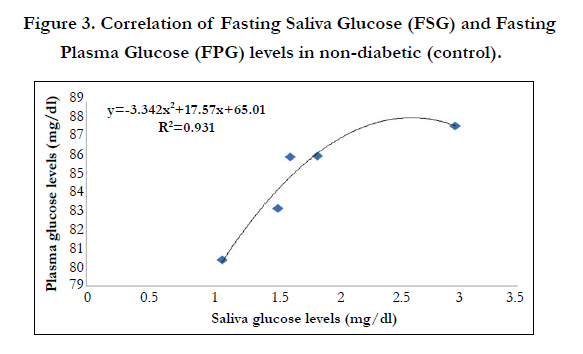
Figure 3. Correlation of Fasting Saliva Glucose (FSG) and Fasting Plasma Glucose (FPG) levels in non-diabetic (control).
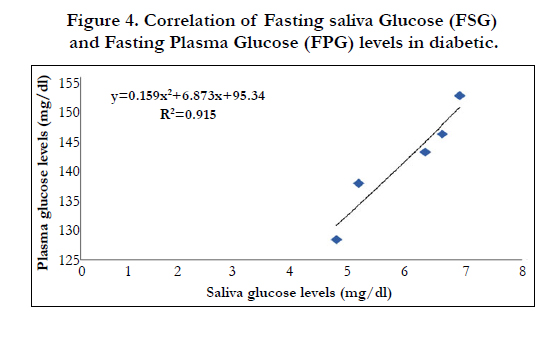
Figure 4. Correlation of Fasting saliva Glucose (FSG) and Fasting Plasma Glucose (FPG) levels in diabetic.
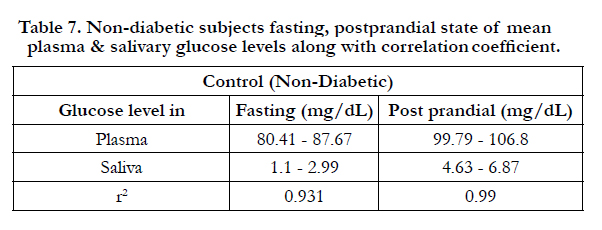
Table 7. Non-diabetic subjects fasting, postprandial state of mean plasma & salivary glucose levels along with correlation
In the diabetic group during fasting and post prandial state the mean plasma glucose levels ranged from 128.32 to 151.97 mg/dl, 195.65 to 217.77 mg/dl and mean salivary glucose levels ranged from 4.63 to 6.87mg/dl, 10.57 to 16.19 mg/dl. The correlation coefficient between fasting and post prandial glucose levels of saliva Vs plasma was calculated and the r-value was found to be 0.915 and 0.961. Comparisons of salivary glucose levels between the control and patient groups were performed with a t-test and the difference was found to be less significant (P>0.05). The results were depicted in Figure-5&6 and Table 8.
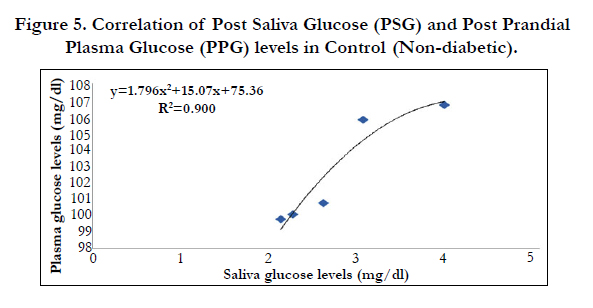
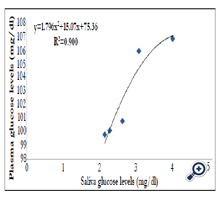
Figure 5. Correlation of Post Saliva Glucose (PSG) and Post Prandial Plasma Glucose (PPG) levels in Control (Non-diabetic).
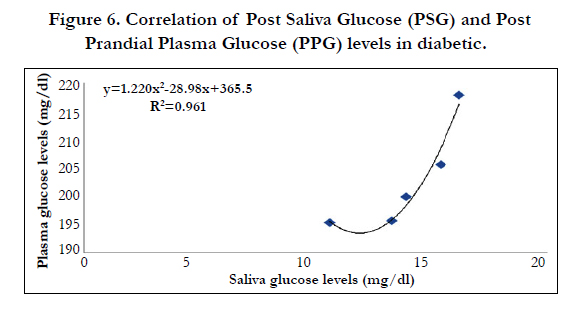
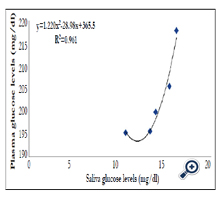
Figure 6. Correlation of Post Saliva Glucose (PSG) and Post Prandial Plasma Glucose (PPG) levels in diabetic.
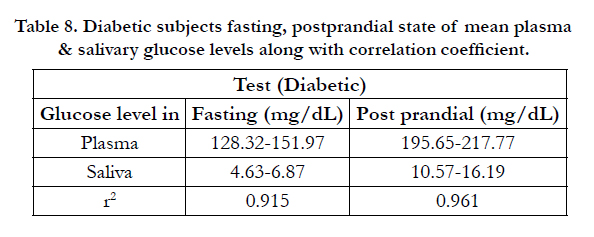
Table 8. Diabetic subjects fasting, postprandial state of mean plasma & salivary glucose levels along with correlation coefficient.
Glucose was detectable in saliva of both diabetic and non diabetic individuals. A significant positive correlation was established between blood glucose and salivary glucose levels. Values observed regarding blood and saliva glucose level were found distinctly different between normal and diabetic subjects suggesting that monitoring of saliva glucose level can be used as an index of diabetes mellitus. The results were depicted in Figure 7 and 8.
Conculsion
From the present study it was observed that the best cut off value for fasting salivary sugar level was 2.0 mg/dl and post prandial salivary glucose level was 4.0 mg/dl for patients of Guntur, Andhrapradesh. These estimated values could be taken as reference values and similar studies should be done at different Indian states or regional centers so as to validate a standard salivary glucose level to be used for screening of diabetes as a non invasive, simple and cost effective method.
Acknowledgement
The authors are thankful to President, Chalapathi Educational Society, Principal, Chalapathi Institute of Pharmaceutical Sciences, Guntur for providing necessary research facilities for carrying out the research work.
References
- Pohl SL, Gonder-Fredrick LA, Cox DJ, Evans WS (1985) Self measurement of blood glucose concentrations: Clinical significance of patient generated measurements. Diabetes Care 8(6): 617-619.
- Khalil OS (1999) Spectroscopic and clinical aspects of non invasive glucose measurements. Clin Chem 45(2): 165-177.
- Amer S, Yousuf M, Siddqiui PQ, Alam J (2001) Salivary glucose concentrations in patients with diabetes mellitus-a minimally invasive technique for monitoring blood glucose levels. Pakistan Journal of Pharmaceutical Sciences 14(1): 33-37.
- NIHPublication:No:04551Oct:2003
- http://www.mydr.com.au/tests-investigations/diabetes-and-urine-glucosemonitoring.
- Ginsberg BH (1992) An overview of minimally invasive technologies. Clin Chem 38(9): 1596-1600.
- Chiappin S, Antonelli G, Gatti R, De Palo EF (2007) Saliva specimen: A new laboratory tool for diagnostic and basic investigation. Clin Chim Acta 383(1-2): 30-40.
- Kaufman E, Lamster IB (2002) The diagnostic applications of saliva-A review. Crit rev Oral Biol Med 13(12): 197-212.
- Mehrotra KK, Chawla TN, Kumar A (1968) Correlation of salivary sugar with blood sugar. J Indian Dent Assoc 40(10): 265-269.
- Marchetti P, Tognarelli M, Giannarelli R (1989) Decreased salivary glucose secretory rate: usefulness for detection of diabetic patients with autonomic neuropathy. Diabetes Res Clin Pract 7(3): 181-186.
- Huizinga MM, Rothman RL (2006) Addressing the diabetes pandemic: A comprehensive approach. Indian J Med Res 124(5): 481-484.