Prediabetes: The Variation between HbA1c and Fasting Plasma Glucose
White K.A.M1,2#, Daneshvari S3#, Lilyquist J1,2, Luo L2, Steffen L.E4,5, Bivin A1, Gurule N4, Ducasa G.M1, Torres S.M5, Lindeman R2, Sankarappan S2, Berwick M1,2*#
1 Molecular Epidemiology Laboratory, University of New Mexico, Albuquerque, New Mexico, USA.
2 Division of Epidemiology, University of New Mexico, Albuquerque, New Mexico, USA.
3 Health Sciences Library and Informatics Center, University of New Mexico, USA.
4 Department of Cancer Biology, University of Colorado Anschutz Medical Campus, USA.
5 Department of Psychology, University of New Mexico, Center for HPV Prevention, Department of Pathology, University of New Mexico, USA.
*Corresponding Author
Marianne Berwick,
Molecular Epidemiology Laboratory,
University of New Mexico, MSC10 5550,
Albuquerque, NM 87131-0001, Albuquerque, New Mexico, USA.
Tel: (505) 272-4369
Fax: (505) 272-2570
E-mail: mberwick@salud.unm.edu
Article Type: Review Article
Recieved: April 11, 2015; Accepted: May 30, 2015; Published: June 05, 2015
Citation: Berwick M et al., (2015) Prediabetes: The Variation between HbA1c and Fasting Plasma Glucose. Int J Diabetol Vasc Dis Res, S2:001 1-7. doi: dx.doi.org/10.19070/2328-353X-SI02001
Copyright: Berwick M© 2015. This is an open-access article distributed under the terms of the Creative Commons Attribution License, which permits unrestricted use, distribution and reproduction in any medium, provided the original author and source are credited.
Abstract
Purpose: The prevalence of Diabetes Type 2 is on the rise internationally. Currently, Fasting Plasma Glucose (FPG) and HbA1c are both used to determine if an individual is diabetic or prediabetic. We aimed to describe the prevalence of diabetes, prediabetes, and glycemic control in a population-based sample of elderly Hispanic and non-Hispanic White participants in New Mexico.
Methods: To do this, we compared HbA1c with FPG using Chi-Square analysis across gender and ethnicity to provide information for future health care policy. We also performed non-parametric regression using a locally weighted smoothing technique to investigate the relationship between FPG and HbA1c levels.
Results: Our analysis identifies a large variation between the sensitivity of HbA1c and FPG in the identification of both prediabetes and diabetes. Interestingly, 95% of diabetics defined by FPG are also defined by HbA1c, representing overlap between the two measures. When comparing the prevalence of prediabetes between the two measures, the overlap of FPG with HbA1c was only 30% and HbA1c identifies more individuals as prediabetic than FPG. Prevalence of diabetes was also higher when defined by HbA1c compared to FPG and the overall agreement between HbA1c and FPG appears to be poor particularly by sex and ethnicity (K=0.22-0.34). Glycemic control was poor overall with Hispanics displaying a larger
amount of uncontrolled diabetes.
Conclusion: We compared HbA1c and FPG by gender and ethnicity and showed both measures of diabetes differ in their sensitivity across ethnic groups. Our results suggest that using HbA1c, rather than FPG, results in higher rates of prediabetes and diabetes, a finding with numerous implications for health care practice.
2.Abbreviations
3.Introduction
4.Goal of Study
5.Methods
5.1 Participants
5.2 Laboratory Methods
5.3.Criteria for Determining Diabetic Status, Glycemic Control,and Estimated Average Glucose
5.4 Statistical Methods
6.Results
7.Conclusion
8.Limitations
9.Acknowledgements
10.References
Keywords
Diabetes; Type 2 Diabetes; Ethnicity; Hispanics.
Abbreviations
World Health Organization (WHO); Type 2 Diabetes (T2D); Center for Disease Control (CDC); American Diabetes Association (ADA); Non-Hispanic whites (NHW); Socioeconomic Status (SES).
Introduction
More than 382 million people are living with diabetes throughout the world [1], 90% of whom suffer from Type 2 diabetes (Type-2 DM) [2]. Currently, 29.1 million Americans (9.3% of the population) have a diagnosis of diabetes (Type-1, -2, and gestational) [3]; diabetes incidence, Type-2 DM in particular, is increasing in the U.S and throughout the world [4]. The prevalence of diabetes in the U.S. alone is estimated to rise to 53.1 million by 2025 [1]. Rates of diabetes are also projected to increase 63 % by 2015, but the true rate of diabetes in the U.S. may be even higher, as it is estimated that 8.1 million people are currently living with undiagnosed diabetes [3, 5]. Diabetes is often undetected due to difficulty in testing, poor access to health care and limited health education, making accurate diagnosis a substantial public health problem. Furthermore, 86 million people in the U.S. have prediabetes [5]. Prediabetes is a condition in which blood glucose levels are elevated but not high enough to meet the criteria for Type-2 DM(3).
Type-2 DM is a chronic condition that affects the way the body metabolizes sugar (glucose) [6, 7] and may be due to an incretin deficiency [5]. Incretins, members of the glucagon superfamily, are gut-derived metabolic hormones that stimulate pancreatic insulin secretion in a glucose-dependent manner in order to decrease blood glucose levels. Incretins play an important role in both the local gastrointestinal and whole-body response to fluctuating glucose levels. Incretin deficiency and/or resistance contribute to Type-2 DM.
Type-2 DM typically begins with insulin resistance, a disorder in which muscles, liver, and fat cells cannot use insulin properly to control blood glucose levels. As the demand for insulin increases, the insulin producing cells in the pancreas gradually lose the ability to produce sufficient amounts of insulin to regulate blood glucose [8]. Type-2 DM is associated with age, ethnicity, and genetics, as well as lifestyle modifiers including weight or body mass index, central adiposity, and sedentary lifestyle [4, 8].
In addition to an increased risk of diabetes, people with prediabetes have 1.5 times more risk of heart and blood vessel disease [5] such as high blood pressure, stroke, and heart attack. Interventions such as physical activity, weight loss and healthy food choices can prevent prediabetes from progressing to Type-2 DM. Without intervention, 15% to 30% of people with prediabetes will likely develop Type-2 DM within five years [8].
In order to evaluate risk factors for Type-2 DM, it is critical to have consistent measures. There are two laboratory tests for diabetes: a fasting plasma glucose (FPG) test measures the amount of blood glucose, the major source of energy for most cells of the body. A FPG level of greater than 100 but less than 126 is considered prediabetic while a level greater than or equal to 126 is classified as diabetic. Conversely, the HbA1c assay quantifies the level of glycated hemoglobin thus approximating the average blood glucose levels over the lifetime of red blood cells (8 to 12 weeks). This test, therefore, reflects the average blood glucose levels over a period of three months. An HbA1c level of 5.7 to less than 6.5 is considered prediabetic and greater than or equal to 6.5 is classified as diabetic. Currently, diabetes is clinically defined by FPG and not by glycation of proteins as measured by HbA1c. However, the American Diabetes Association (ADA) recently added HbA1c as a diagnostic criterion for diabetes and suggested that either HbA1c or FPG should meet the diagnostic requirements for Type-2 DM [5]. There is still debate as to whether HbA1c should be used to supplement FPG testing or if it can stand alone as a diagnostic test for diabetes and prediabetes [9].
Some clinicians suggest that HbA1c has poor sensitivity in diabetes diagnosis and its use as a diagnostic would alter the epidemiology of diabetes [10]. Still, many clinicians prefer to use HbA1c to identify diabetes in their patients, as chronic hyperglycemia is captured by HbA1c, fasting is not required for assessment and it is a useful marker of risk of other diseases [11]. In addition, higher HbA1c levels are more strongly related to increased all-cause mortality in women [12]. HbA1c levels greater than 6.5 % have met the requisite sensitivity and specificity to identify patients at risk for developing diabetic retinopathy [13]. Another advantage of HbA1c is that acute perturbations, which cause variation in FPG (including stress, diet, exercise, and smoking), do not affect the results. Three international committees of experts [1, 5, 14] have recommended that the HbA1c test be the primary test used to diagnose prediabetes, Type-1 diabetes and Type-2 diabetes. However, these committees recommended that clinicians continue to use FPG to confirm the diagnosis following HbA1c testing.
Age, gender and race/ethnicity have previously been implicated in the modification of FPG and HbA1c measurements. Despite data suggesting that FPG and HbA1c may be affected by race/ ethnicity, the percentage of U.S. adults overall with prediabetes is estimated to be similar for non-Hispanic whites (NHW) (35%), non-Hispanic blacks (39%), and Hispanics (38%). Understanding the role of age, gender, and ethnicity in the diagnosis, prevalence and control of prediabetes and Type-2 DM addresses an important public health concern that can inform prevention and disease management programs.
To date, there is evidence, despite equivalent prevalence rates, that ethnicity/race, age and sex affect FPG results. One study illustrating the difference in the processing of glucose by age showed that people above age 60 had lower FPG levels for the same post-load glucose concentration than younger people [15]. Another study of Southeastern Asian subjects, older than 65 years, reported high false-negative rates with FPG (60.8%) for detecting Type-2 DM [16]. Oh et al. (2002) demonstrated that gender, specifically gender related endogenous hormones, may impact FPG [17]. They reported that both bioavailable testosterone and estradiol were positively associated with FPG in women, while in men total testosterone was inversely related to FPG. Finally, gender and race/ ethnicity were shown to affect FPG, and the distribution of FPG was shifted higher in men compared to women, as well as in Mexican- Americans compared to NHW [18].
Similar to variations in FPG, HbA1c values are affected by age, gender, and race/ethnicity. Data from the National Health and Nutrition Examination Survey (NHANES) population indicates that HbA1c increases by 0.10% per year with age, independent of fasting glucose levels [19]. In the same study on elderly Southeastern Asian subjects [16], the use of HbA1c reported high falsenegativerates of 35.1% along with low sensitivity (58.7%, 95% CI 50.4–65.7) and low specificity (71.1%, 95% CI 57.3–82.6) for Type-2 DM detection when compared to younger age groups [16]. Although HbA1c performed better for detecting Type-2 DM than FPG in the sample, it still failed to detect one-third of cases identified by FPG [13].
In addition, hemoglobin levels affect HbA1c values. Bae and colleagues showed that Korean women have a lower mean hemoglobin value when compared with Korean men [20]. There is a significant gender-specific association between age and HbA1c, such that women had lower HbA1c than men, unless they were over the age of 55 years [20]. As a result, HbA1c cut offs derived from population studies across genders and age groups may be less accurate in older subjects.
Racial/ethnic differences may also account for discrepancies in sensitivity of HbA1c to detect Type-2 DM because ethnicity affects hemoglobin glycation, independent of sex and body mass index [21, 22]. For example, Menke and colleagues reported that the distribution of HbA1c was shifted higher for non-Hispanic blacks when compared to NHW [18]. In addition, Venkataraman and colleagues (2012) reported that HbA1c was increased more in Malays and Indians compared with Chinese, even after adjustment for age, gender, waist circumference, serum cholesterol, and serum triglyceride[23].
Concentrations of HbAlc and FPG clearly differ in important ways by ethnicity and gender [20, 23]; the reasons for these differences are poorly understood and require further investigation.
Hispanics have a high prevalence of Type-2 DM [5], although there is variation in age-adjusted rates of diabetes among subcultures of Hispanics. Central and South Americans have an age-adjusted rate of diabetes of 8.5%, Cubans 9.3%, Mexican Americans 13.9% and Puerto Ricans 14.8% [5]. The 2014 rate of diabetes for Native American Indians/Alaskan Natives is 15.9% [5]. Hispanics originating in New Mexico are genetically identified as 26-27% Native American, 71-72% European ancestry and 2% African American [24]. Interestingly, Hispanics in the Southwest have been reported to have an increased prevalence of insulin resistance syndrome which contributes to the development of diabetes [25].
Lindeman and colleagues (1998) also showed that elderly New Mexican Hispanics have twice the prevalence of Type-2 DM compared with elderly NHW [26]. In this study, prediabetes was not evaluated leaving the question of whether there could be more undiagnosed prediabetics within NHW and Hispanics.
Goal of Study
Given these differences between HbA1c and FPG, our goal was todescribe the prevalence of diabetes, prediabetes, and glycemic control in a population-based sample of elderly Hispanic and NHW participants. To do this, we compared HbA1c with FPG across gender and ethnicity to provide information for future health care policy.
Methods
Participants
The data are from a previous study where participants were randomly selected from the Medicare rolls of Bernalillo County (Albuquerque, NM; age ≥ 65 years). Participants who completed a home interview along with an interview and examination by a nurse practitioner, nurse, and nutritionist were included in this study (n=883). A total of 849 participants, either NHW (n=457) or Hispanic adults (n=392), aged 65 years and older, were included in our analysis as they had both HbA1c and FPG measurements from blood samples [26]. Diabetes status was also self-reported during the interview and included information on the use of insulin and oral hypoglycemics within the last year. Since the study by Lindeman and colleagues was not focused on diabetes it is unknown how many individuals in the sample (N=854) had Type -I DM. Using self-identification of Type-2 DM and the criteria for HbA1c there were 260 individuals in the sample that were positive for Type-2 DM. Using FPG, however, there were only 80 individuals diagnosed as Type-2 DM.The classification of Hispanic in our study is a based on participants having a Spanish surname, being Spanish-speaking, or originating from a Spanishspeaking country. The actual term “Hispanic” refers to a heterogeneous population making generalized statements difficult. In New Mexico, there are two major populations of Hispanics, Mexican- Americans whose ancestors originate from Mexico, and the Spanish-Americans, whose ancestors originate from Spain. Of this study population, 83% self-identified as Spanish- American,10% as Mexican-American, 5% as Hispanic-Native Americans, and 3% as other Hispanics (e.g., Cuban, Puerto Rican, and Central and South American).
Blood samples were drawn between 8:00 and 8:30 A.M. after an overnight fast and assayed for serum glucose, insulin and HbA1c. Glucose was determined by anenzymatic test (hexokinase enzymatic assay) using a Roche-Cobas Bio instrument and reagents from Beckman Instruments (Carlsbad, CA). Briefly, the reduction of NAD+ to NADH is associated with glucose phosphorylated by hexokinase (HK) we measured the increase in absorbance at 340nm which is proportional to the glucose concentration in the sample.
A radioimmunoassay (RIA) was used to determine insulin concentrations (Diagnostic Products, Los Angeles, CA) and HbA1c levels (Endocrine Science Products, Calabasas Hill, CA) as described previously [26]. Briefly, using RIA, a double-antibody method, we measured insulin or HbA1c in our participant’s serum. Radioactive isotopes were mixed with patient’s samples and antibodies specific for insulin or HbA1c and competed with a fixed amount of 125I-labelled insulin or HbA1c for binding sites. Bound and free insulin or HbA1c were then separated using a secondary antibody and the amount of free radioactivity was measured. The measurable radioactivity was recorded and is inversely proportional to the quantity of insulin or HbA1c in the specimen.
Participants were placed in one of three diabetic categories: normal, pre-diabetic, and diabetic. Diabetes Mellitus diagnostic criteria based on FPG and HbA1c results were determined using ADA categories as well as a local reference laboratory’s classification [5, 27]. These criteria included a FPG ≥ 126 mg/dl (7.0 mmol/l) OR HbA1c ≥ 6.5%. Categories of increased risk for diabetes (prediabetes) criteria included FPG levels of between 100 to 125mg/dl (5.6 - 6.9mmol/l) or HbA1c: 5.7 - 6.4%.
Among participants categorized as diabetic and on medication within the last year, glycemic control was defined as HbA1c of < 7.0%(28).
Chi-square analyses were performed on both HbA1c and FPG values by ethnicity, gender, and education. Using logistic regression, we adjusted for confounding factors, including age, ethnicity, gender and education. Education was used as a proxy for socioeconomic status as the retirement status of individuals over the age of 65 has the potential to modify income.
To assess glycemic control, achi-square analysis was performed on the use of medications and diabetic status by ethnicity and gender. (StataCorp. 2013. Stata Statistical Software: Release 13. College Station, TX: StataCorp LP).
Kappa statistics were calculated to measure the agreement between the normal, prediabetes, and diabetes status classified by HbA1c and FPG. Scatter plots with linear regression fit and locally weighted regression fit were used to explore the relationship between the HbA1c and glucose levels in this population.
We performed non-parametric regression using a locally weighted smoothing technique in addition to standard linear regression analysis in order to investigate the relationship between FPG and HbA1c levels stratified by gender and ethnicity (SAS 9.3, Cary, NC).
Results
Within our population, there was a relatively even distribution of Hispanics (46.2%) and NHW (53.8%) (Table1). There were no significant differences in age or gender when Hispanics were compared to NHW. There were significant differences between Hispanics and NHW by socioeconomic status (SES) as represented by educational level (p<0.0001). However SES was not found to be associated with risk of prediabetes or diabetes (p=0.1461) (data not shown).
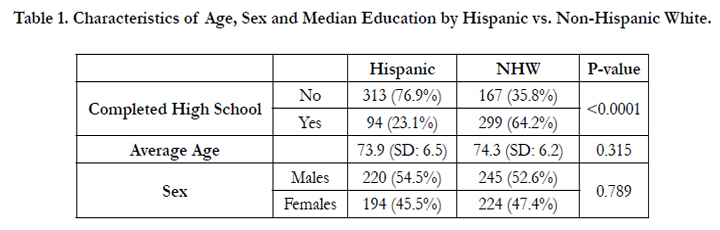

Table 1. Characteristics of Age, Sex and Median Education by Hispanic vs. Non-Hispanic White.
FPG and HbA1c were determined using ADA criteria (Table 2) [5, 27]. FPG and HbA1c were similarly correlated among gender and ethnic groups (Figure 1). However, in females the correlation was not linear in the extreme upper bounds of our data. This indicated that there is not a constant linear relationship between FPG and HbA1c, although more linear when HbA1c was less than 6.4. This is similar to what was found by the Ramachandran group [29] who also reported a steeper, relatively linear comparison. We report a horizontal linear fit for low HbA1c values, which indicates that FPG levels do not change as HbA1c changes, when HbA1c is less than 6.4 (Figure 1). This non-parametric method does not assume a strictly linear relationship between FPG and HbA1c levels, and describes their relationship over certain ranges of the data rather than globally. However, as HbA1c increases to greater than 6.4, a steeper linear relationship between FPG and HbA1c is observed, where the slope coefficient is comparable to the linear regression results. This is clinically relevant as the reduction of HbA1c by one percentage point has been associated with a 40% reduced risk of eye, kidney, and nerve diseases, complications present with diabetes.
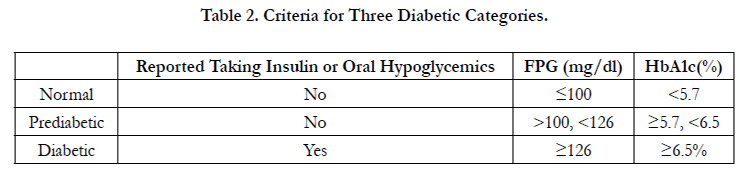
Table 2. Criteria for Three Diabetic Categories.
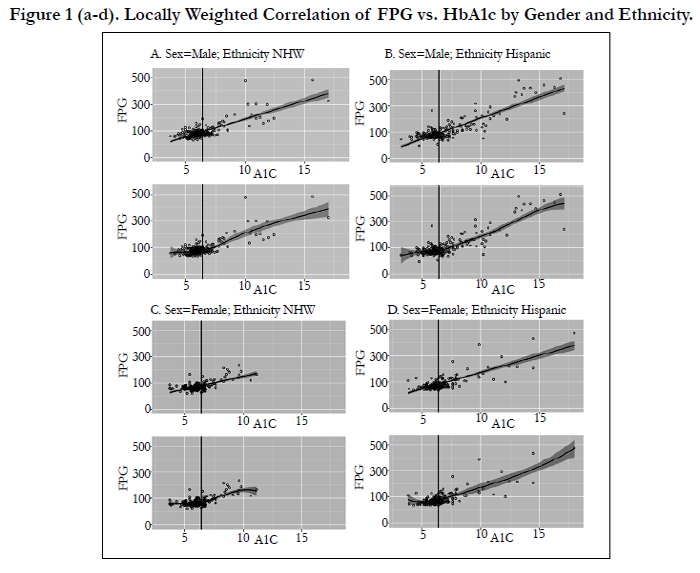
Figure 1 (a-d). Locally Weighted Correlation of FPG vs. HbA1c by Gender and Ethnicity.
Our analysis identifies a large variation between the sensitivity of HbA1c and FPG in the identification of both prediabetes and diabetes. Prevalence of prediabetes and diabetes was higher when defined by HbA1c compared to FPG levels. Interestingly, 95% of diabetics defined by FPG are also defined by HbA1c, representing overlap between the two measures. However, total diabetes prevalence by HbA1c was greater, and the overall agreement between the two measures appears to be poor, particularly by sex and ethnicity between HbA1c and FPG. (K=0.22-0.34) (Table3). For prediabetics, the overlap of FPG with HbA1c was only 30% andof clinical importance, HbA1c identifies more individuals as prediabetic than FPG. HbA1c identified more prediabetics and diabetics, particularly in Hispanic males, which suggests that the threshold for FPG may vary in our population particularly at the extremes. Our data supports the idea that FPG varies by ethnicity. Therefore, prediabetes and diabetes thresholds should be adjusted for Hispanic and non-Hispanic ethnicity.
Glycemic control for individuals on medication within the last year was poor (n=56) (Figure 2). Further, diabetes was less controlled among Hispanics compared with NHW (p<0.0001). However, the sample size of those with pre-diabetes and diabetes is relatively small, and these results require further investigation.
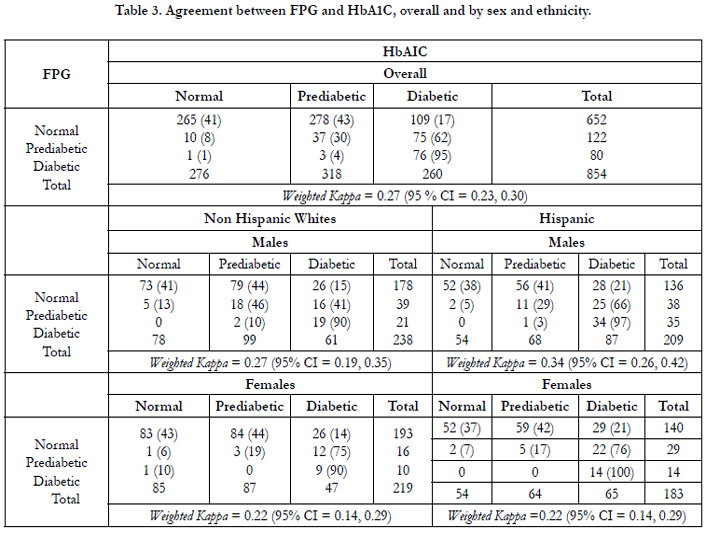
Table 3. Agreement between FPG and HbA1C, overall and by sex and ethnicity.
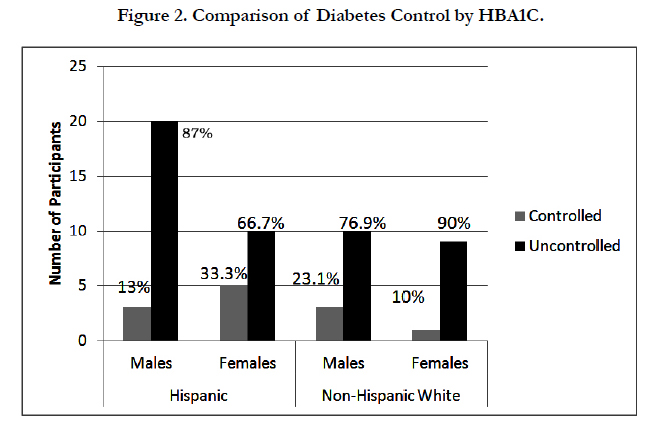
Figure 2. Comparison of Diabetes Control by HBA1C.
Conclusion
The goal of this study was to describe the different prevalence of diabetes, prediabetes, and glycemic control in a population-based sample of elderly Hispanic and NHW participants by comparing HbA1c and FPG. Our results suggest that using HbA1c, rather than FPG, results in higher rates of prediabetes and diabetes, a finding with numerous implications for healthcare practice. Using HbA1c might result in higher rates of false-positives, which could lead to unnecessary testing, treatment, anxiety, and potential discrimination by insurers. However, it could also result in earlier lifestyle intervention and consistent monitoring. For clinicians, HbA1c provides several advantages over FPG, including the lack of fasting prior to testing, which may increase compliance and monitoring by patients and the fact that external factors, including those confounders, which may particularly impact elderly populations, do not affect HbA1c levels. Finally, the risk of false positives among those diagnosed using HbA1c may be outweighed by the potential to overcome the known disparities in the identification and treatment of prediabetes in individuals with lower SES [28].
Southwestern Hispanics, compared with overall Hispanics in the U.S., have been reported to have a higher prevalence of diabetes than NHW [30], and previous studies have indicated that Hispanic men are at an almost a two fold increase in risk for diabetes when compared with NHW men. In our population, Hispanic men were less likely to have glycemic control of their diabetes, but it is unclear whether this is due to differences in testing by gender/ethnicity, disease progression of diabetes by gender/ethnicity, lifestyle or in care of diabetics by gender/ethnicity. As discussed previously, potential variations in the glycation of proteins by gender and ethnicity may result in changes in HbA1c results. As HbA1c typically monitors glycemic control, and HbA1c appears to identify more diabetics in our population, this increase could improve the care of those being monitored.
Limitations
As mentioned previously, HbA1c cut offs derived from population studies may be less accurate in older subjects. This is not a variable we can correct and represents a limitation of our study design. Since SES in our population was influenced by retirement status, we used level of education as a proxy marker for SES. This variable may have limited our ability to predict the impact income has on the early identification of prediabetes.
Given the differences between HbA1c and FPG, we sought todescribe the prevalence of diabetes, prediabetes, and glycemic control in a population of Hispanic and NHW participants. We compared HbA1c with FPG across gender and ethnicity and showed both measures of diabetes differ in their sensitivity across two ethnic groups. In addition the increased sensitivity of HbA1c might result in higher rates of false-positives, but could provide early intervention points and increase glycemic control due to ease of monitoring. In the future it would be important to consider adapting HbA1c ranges based on ethnicity and to create studies, which examine how effective glycemic control program and education intervention programs are for the Hispanic population.
Acknowledgement
This project was supported in part by the K05 CA131675 and the National Center for Research Resources and the National Center for Advancing Translational Sciences of the National Institutes of Health through Grant Number UL1 TR000041. The content is solely the responsibility of the authors and does not necessarily represent the official views of the NIH.
# These authors contributed equally to this work.
References
- International Diabetes Federation Annual Report (2013) 1–40. http://www.idf.org/files/idf_publications/idf_annual_report_2013_EN/index.html
- WHO (World Health Organization) Diabetes mellitus.
- National Diabetes Statistics Report (2014). http://www.cdc.gov/diabetes/pubs/statsreport14/national-diabetes-report-web.pdf
- Nyenwe EA, Jerkins TW, Umpierrez GE, Kitabchi AE (2011) Management of type 2 diabetes: evolving strategies for the treatment of patients with type 2 diabetes. Metabolism 60(1): 1–23.
- American Diabetes Association (2014) National Diabetes Statistics Report, Statistics About Diabetes. http://www.diabetes.org/diabetes-basics/statistics/
- Diabetes Mellitus (DM) (2015) Diabetes Mellitus and Disorders of Carbohydrate Metabolism: Merck Manual Professional. http://www.merckmanuals.com/professional/endocrine_and_ metabolic_disorders/diabetes_mellitus_and_disorders_of_carbohydrate_metabolism/diabetes_mellitus_dm.html
- Loghmani E (2005) Diabetes Mallitis: Type 1 and Type 2. Guidel Adolesc Nutr Serv 167–82.
- Kramer MK, Kriska AM, Venditti EM, Miller RG, Brooks MM, et al.,(2009) Translating the Diabetes Prevention Program: a comprehensive model for prevention training and program delivery. Am J Prev Med 37(6):505–11.
- The International Expert Committee (2009) International Expert Committee report on the role of the A1C assay in the diagnosis of diabetes. Diabetes Care 32(7): 1327–34.
- Bonora E, Tuomilehto J (2011) The pros and cons of diagnosing diabetes with A1C. Diabetes Care34(2): 184–90.
- Pai JK, Cahill LE, Hu FB, Rexrode KM, Manson JE, et., (2013) Hemoglobin a1c is associated with increased risk of incident coronary heart disease among apparently healthy, nondiabetic men and women. J Am Heart Assoc 2(2):1–9.
- Parikh A, Lipsitz S, Natarajan S (2008) Gender Differences In The Effect Of Hemoglobin A1c On Mortality In Adults with Diabetes: Findings From A National Population-based Follow-up Study. Circulation 118(18): 1134.
- Cheng YJ, Gregg EW, Geiss LS, Imperatore G, Williams DE, et al., (2009) Association of A1C and fasting plasma glucose levels with diabetic retinopathy prevalence in the U.S. population: Implications for diabetes diagnostic thresholds. Diabetes Care 32(11): 2027–32.
- Inzucchi SE, Bergenstal RM, Buse JB, Diamant M, Ferrannini E, et al., (2012) Management of hyperglycemia in type 2 diabetes: a patient-centered approach: position statement of the American Diabetes Association (ADA) and the European Association for the Study of Diabetes (EASD) Diabetes Care 35(6): 1364–79.
- Ito C, Maeda R, Ishida S, Harada H, Inoue N, et al., (2000) Importance of OGTT for diagnosing diabetes mellitus based on prevalence and incidence of retinopathy. Diabetes Res Clin Pract 49(2): 181–6.
- Khoo J, Tay T-L, Foo J-P, Tan E, Soh S-B, et al., (2012) Sensitivity of A1C to diagnose diabetes is decreased in high-risk older Southeast Asians J Diabetes Complications. 26(2): 99–101.
- Oh J-Y, Barrett-Connor E, Wedick NM, Wingard DL (2002) Endogenous sex hormones and the development of type 2 diabetes in older men and women: the Rancho Bernardo study. Diabetes Care 25(1): 55–60.
- Menke A, Rust KF, Savage PJ, Cowie CC (2014) Hemoglobin A1c, fasting plasma glucose, and 2-hour plasma glucose distributions in U.S. population subgroups: NHANES 2005-2010. Ann Epidemiol 24(2): 83–9.
- Pani LN, Korenda L, Meigs JB, Driver C, Chamany S, et al., (2008) Effect of aging on A1C levels in individuals without diabetes: evidence from the Framingham Offspring Study and the National Health and Nutrition Examination Survey 2001-2004. Diabetes Care 31(10): 1991–6.
- Bae JC, Suh S, Jin S-M, Kim SW, Hur KY, et al., (2014) Hemoglobin A1c values are affected by hemoglobin level and gender in non-anemic Koreans. J Diabetes Investig 5(1): 60–5.
- Bloomgarden ZT (2009) A1C: recommendations, debates, and questions. Diabetes Care 32(12): 141–7.
- Herman WH (2009) Do race and ethnicity impact hemoglobin A1c independent of glycemia? J Diabetes Sci Technol3(4): 656–60.
- Venkataraman K, Kao SL, Thai AC, Salim A, Lee JJM, et al., (2012) Ethnicity modifies the relation between fasting plasma glucose and HbA1c in Indians, Malays and Chinese. Diabet Med 29(7): 911–7.
- Heritage New Mexico (2015). http://heritagenm.unm.edu/
- Marshall JA, Hamman RF, Baxter J, Mayer EJ, Fulton DL, et al., (1993) Ethnic differences in risk factors associated with the prevalence of non-insulin- dependent diabetes mellitus. The San Luis Valley Diabetes Study. Am J Epidemiol 37(7): 706–18.
- Lindeman RD, Romero LJ, Hundley R, Allen AS, Liang HC, et al., (1998) Prevalences of type 2 diabetes, the insulin resistance syndrome, and coronary heart disease in an elderly, biethnic population. Diabetes Care 21(6): 959–66.
- Test Directory - TriCore Reference Laboratories (2015). http://www.tricore.org/test_directory
- Khattab M, Khader YS, Al-Khawaldeh A, Ajlouni K (2010) Factors associated with poor glycemic control among patients with Type 2 diabetes. J Diabetes Complications 24(2): 84–9.
- Ramachandran A, Riddle MC, Kabali C, Gerstein HC (2012) Relationship between A1C and fasting plasma glucose in dysglycemia or type 2 diabetes: an analysis of baseline data from the ORIGIN trial. Diabetes Care 35(4):749–53.
- Talamantes M, Lindeman R, Mouton C (2005) Health and Health care of Hispanic/ Latino American elders. http://web.stanford.edu/group/ethnoger/hispaniclatino.html