Trans Fatty Acids, Biochemical and Microbiological Quality of Selected Tunisian Hams
Selmi S1*, Ben Slama F2, Ghiloufi R1, El Ati J1, Krifi B3
1 Department of Food Technology and Research Laboratory Nutritional Surveillance and Epidemiology, National Institute of Nutrition and Food
Technology, 1007 Tunis, Tunisia.
2 Nutrition Department, Higher School of Health Sciences and Techniques of Tunis, 1007 Tunis, Tunisia.
3 Higher Institute of Biotechnology of Monastir, University of Monastir, Tunisia.
*Corresponding Author
Salah SELMI,
National Institute of Nutrition and Food Technology, 11, rue jebel lakhdar, Bab Sâadoun,
1007 Tunis, Tunisia. Dep. Food Technology ; SURVEN LR12SP05 Laboratory.
E-mail: salahw3@yahoo.fr
Received: October 19, 2019; Accepted: December 09, 2019; Published: December 12, 2019
Citation: Selmi S, Ben Slama F, Ghiloufi R, El Ati J, Krifi B. Trans Fatty Acids, Biochemical and Microbiological Quality of Selected Tunisian Hams. Int J Food Sci Nutr Diet. 2019;8(5):427-433. doi: dx.doi.org/10.19070/2326-3350-1900076
Copyright: Selmi S© 2019. This is an open-access article distributed under the terms of the Creative Commons Attribution License, which permits unrestricted use, distribution and reproduction in any medium, provided the original author and source are credited.
Abstract
Forty forts samples of hams were selected from hyper market and categorized as Turkey ham, spiced turkey ham, Turkey ham for children, smoked turkey ham, turkey ham enriched with n-3 fatty acids, and chicken ham). Vegetables oils for ham preparation were also studied. Total fat ranged from 1.33 ± 0.31 to 12.63 ± 0.84 g/100g of fresh product and the maximum was found in turkey ham. Saturated and n-3 fatty acids showed a significant variation (p<0.05) from 27.2 to 44.9 % and from 0.52 to 11.9 % respectively. About 90% of the analysed ham product contained less than 1% trans fatty acids and 10% more than 2.5%. Ash levels reveal high sodium content in Tunisian ham. All commercialized hams samples are free of pathogenic bacteria and of E. coli. Due to our data, the importance of introduce effective policies for reducing the intake of saturated fat, trans FA and salt is required.
2.Introduction
3.Materials and Methods
4.Results and Discussion
5.Conclusion
6.References
Keywords
Ham; Nutritional Composition; Trans Fatty Acids; PUFA n-3; Consumer.
Introduction
From a nutritional point of view, fat and sodium from processed meat and meat products, such as ham, is considered as ‘‘non healthy’’ nutrient, since it contains cholesterol and large amounts of sodium and saturated fatty acids SFA and very low levels of n-3 polyunsaturated fatty acids PUFA [1, 2]. Therefore, biochemical composition of meat fat depends on many factors, such as animal species, feeding, enrichment, season and every product has to be considered separately. In this way, the increasing awareness of the need for diets to contain higher levels of ‘‘healthy’’ fats has focussed on the importance of the characterisation of fat and trans fatty acids TFA from different meat products.
Recently, food industry and nutritional institutes (National Institute of Health, Department of Food and Nutrition, Portugal; Spanish Agency for Consumer Affairs, Food Safety and Nutrition…) has increased efforts in order to quantify and reduce TFA amounts, especially in processed foods [3, 4]. There is consistent evidence on industrial TFA and damaging health effects particularly on coronary heart disease and diabetes, while no reports are available on beneficial health impact [5-7].
In 2004, Denmark was the first country in the world to introduce a limitation on the content of industrialized produced TFA in foods [8]. The exposure to TFA by a high-trans-fat menu in Denmark was reduced from 30 g (industrialized produced TFA) in 2001, to <1 g in 2005. In just a few years, Denmark has thus eliminated a risk factor for ischemic heart disease [9].
In Tunisia, only recommendations for voluntary reduction of trans fat and sodium have been applied by industrials and data on the presence of trans fats and salts in the overall diet should be known, in order to implement adequate measures for its reduction.
The European Food Safety Authority (EFSA) recommended that for food witch considered a source of omega-3, it must be contain more than 0.30 g/100 g, or more than 0.60 g/100 g for high unsaturated omega-3, in accordance to the recommended nutritional intake (2 g/day for an adult male) [10]. For theses reasons, fortification with n-3 PUFA of animal products such as meat and poultry products has received important interest in recent years.
However, consumer acceptability is considered one of the biggest challenges facing this movement [11].
Dietary supplementation of n-3 PUFA has been associated not only with the enrichment of animal products but also with some health benefits for both pigs and poultry [12], which may prompt greater consideration of dietary fatty acid composition when formulating diets. Vegetable-based ingredients such as linseed meals/ oils can be used to support the n-3 FA enrichment of animal diets. However, linolenic acid n-3 in linseed requires elongation and desaturation to generate EPA and DHA, a process which is limited in animals [13].
The aim of this study was therefore, to determine salt and trans FA content and isomers distribution of the most turkey and chicken hams in order to get the first overview of the Tunisian TFA situation. Furthermore, we aimed to assess the microbiological quality of commercialized sliced hams.
Hams samples were selected according to a previous survey in three hyper markets carried out by more than 150 consumers (50% male and 50% female; age between 20 and 45 years).
Forty forts (n=44) hams samples from four Tunisian manufactures were sampled during February and Mars 2018 from 3 hypermarkets and grouped as:
Turkey ham A
Turkey ham B
Turkey ham C
Turkey ham D
Spiced turkey ham E
Turkey ham for children F
Turkey ham enriched with n-3 fatty acids G
Smoked turkey ham SA
Smoked turkey ham SB
Chicken ham CA
Chicken ham CB
The ingredients of all kind of ham are shown in Table 1.
All samples were transported in refrigerated condition (4°C) to the laboratories of Food Technology Department (INNTA, Tunisia) for analyses.
Moisture of the hams samples was determined according to the AOAC method [14] by drying in an oven (BINDER FD 23) at 105°C. Results were expressed as percentage of wet weight (n = 4).
Ash content was determined by burning sample in a furnace (Flli manfredi) at 550°C according to standard method [14]. Results were expressed as percentage of wet weight (n = 4).
Total protein content (% total nitrogen × 6.25) in the homogenized samples was determined by Kjeldahl method [14] using BUCHI Distillation Unit K-314. Results were expressed as percentage of wet weight (n = 3).
Carbohydrate content was obtained by the difference between 100 and the sum of the percentages of crude protein, total fat, moisture, and ash.
The fat extraction of hams samples was carried out by soxhlet method [14] with slight modification. Approximately 10 grams of samples was defatted using 200mL of petroleum ether (60- 80°C) in a continuous Soxhlet extractor for 24h. The obtained petroleum ether extract was subsequently evaporated under a stream of nitrogen and the lipid fraction was then determined gravimetrically.
Fatty acids methyl esters FAMEs were obtained and analysed using the methods described respectively by the international Organization for Standardization [15, 16].
FAMEs were analysed using hp Gaz chromatograph system 6890 series equipped with a flame ionization detector and a CP-Sil 88 capillary column (50m × 0.25 mm i.d. × 0.2 μm film thickness, Agilent J&W). The oven was keep at 185°C and the temperature of the injector and the detector were both 250°C. Helium was used as a carrier gas with a flow rate of 1 ml/min, split ratio was 1:100.
Peaks were identified by comparison of their retention times with:
• PUFA 3 FAMEs standards (SUPELCO, Bellefonte, PA, USA)
• Trans 11-octadecanoic methyl ester (SUPELCO, Bellefonte, PA, USA).
• Trans 9-octadecanoic methyl ester (FLUKA, Sigma Aldrich).
• Linoleic acid methyl ester mix isomer cis/trans (C18:2 cis-9, cis12; C18:2 cis-9, trans12; C18:2 trans-9,cis12; C18:2 trans-9,trans12) (SUPELCO, Bellefonte, PA, USA).
• Linolenic acid methyl ester mix isomer cis/trans (C18:3 cis-9, cis12, cis15; C18:3 cis-9, cis12, trans15; C18:3 cis-9, trans12, cis15; C18:3 cis-9, trans12, trans15; C18:3 trans-9, cis12, cis15; C18:3 trans-9, cis12, trans15; C18:3 trans-9, trans12, cis15; C18:3 trans-9, trans12, trans15) (SUPELCO, Bellefonte, PA, USA).
Fatty acids are given in % of total fatty acids.
The microbiological quality of 8 kinds of samples among 11 collected of turkey and poultry hams was investigated and grouped as 4 kinds of unsmoked turkey hams (A, B, C, F), 2 smoked turkey hams (SA, SB) and 2 poultry hams (CA, CB). The examined germs are as follows: Total Mesophilic Flora (TMF), Total Coliform, Thermotolerant Coliform (E. coli), Sulfite-Reducing Anaerobic (SRA), Staphylococci aureus and Salmonella spp.
The enumeration of Total Mesophilic Flora (TMF) and Total Coliform was done according to the international Organization for Standardization ISO [17, 18].
The Thermotolerant Coliform (TC) and Staphylococcus aureus (SA) were evaluated according to French standard method [19]. A special interest was given to the coagulase positive staphylococci by using a specific medium (Baird-Parker solid medium) at 37°C. The detection of Salmonella spp, Sulfite-Reducing Anaerobic (SRA), Yeast and Molds was also determined [20-22].
Statistical analysis was performed using SPSS software, version 10.0.5. The comparison of analysed parameters was tested using Duncan’s test (95% confidence interval) with one-way ANOVA. Data are expressed as mean ± standard error.
The ingredients of all kind of ham are shown in Table 1.
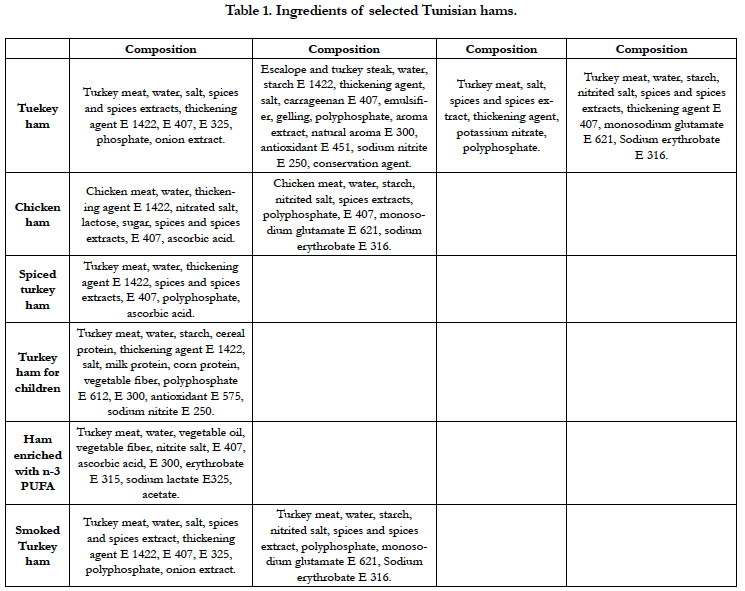

Table 1. Ingredients of selected Tunisian hams.
Forty forts (n=44) hams samples from four Tunisian manufactures were sampled and grouped as:
Turkey ham : forts groups (A, B, C and D),
Chiken ham: tow groups (CA and CB),
Spiced turkey ham: one group (E)
Turkey ham for children: one group (F),
Turkey ham enriched with n-3 fatty acids: one group (G),
Smoked turkey ham: tow groups (SA and SB),
All kind of ham has the same composition with slight modification except group G (enriched with vegetable oil) and groups SA and SB (hams were smoked).
Table 2 shows the proximate composition of the most Tunisian hams products. The lipid and protein contents found in this study in all samples were ranged from 1.33 ± 0.31 to 12.63 ± 0.84 and from 8.85 ± 0.79 to 18.09 ± 0.98 g/100 g respectively. The high lipid level found in this kind of ham is probably related to the turkey and poultry meat composition and not the fat addition for preparation. Lipid levels in raw turkey meat ranged between 11.4 ± 0.01 to 21.7 ± 0.01 g/100g in white and red meat respectively [23]. Generally, lipid and protein contents in hams vary within turkey or poultry species, feed, season and the process for ham preparation.
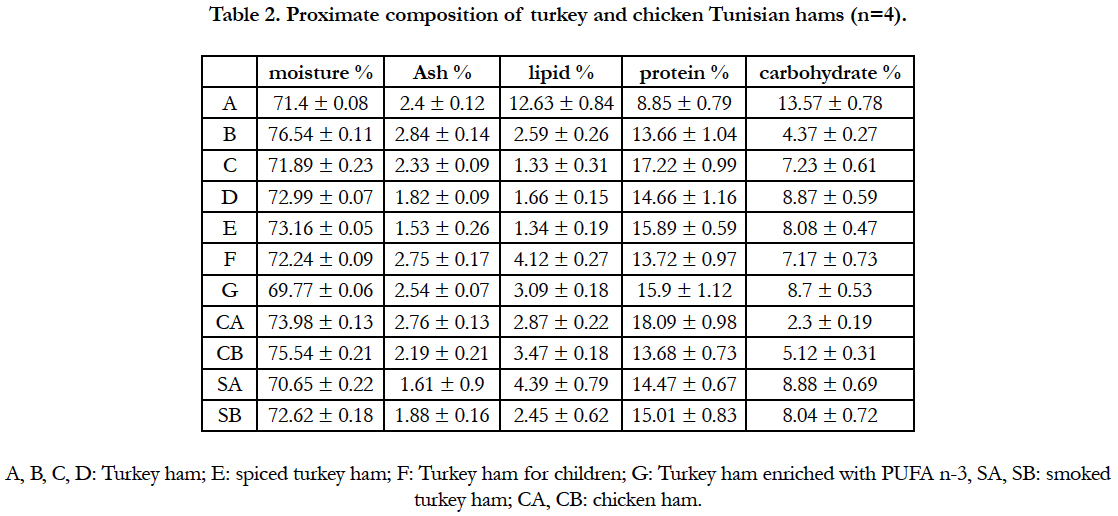
Table 2. Proximate composition of turkey and chicken Tunisian hams (n=4).
According to ash result’s, there is no significant difference in ash content between turkey and chicken hams and the values were ranged from 1.53 ± 0.26 to 2.84 ± 0.14g/100g. Such levels were higher than that found on red or white kazakhsten turkey meat [23, 24]. As it is mentioned in the etiquette label, the high ash content was related to salt supply for ham preparation. It is estimated that one sandwich ham menu contain more than 2g of salt (sodium chloride) and the means of the amount of salt consumed by Tunisian people is more than 8g/day, witch considered so high compared to human body requires (5 g per day) [25].
Unlike developing countries, developed countries like UK, Finland, Australia and Canada are pioneers in the implementation of strategies for salt reduction. Governments in these countries have put a low on the food industry to reduce sodium levels in foods [26].
Results of fatty acids and trans fatty acid composition are shown in Table 3. Turkey hams (A, B, C and D) are very rich in saturated fatty acids SFA (from 33.74 to 44.32%), whereas in the chicken hams (CA, CB), the MUFA fraction was the highest (from 44.78 to 50.25 %), followed by the saturated and polyunsaturated fatty acids (Table 3). Statistical analysis showed that fatty acid composition is strongly affected by the origin of hams (Turkey and chicken) and the process of preparation.
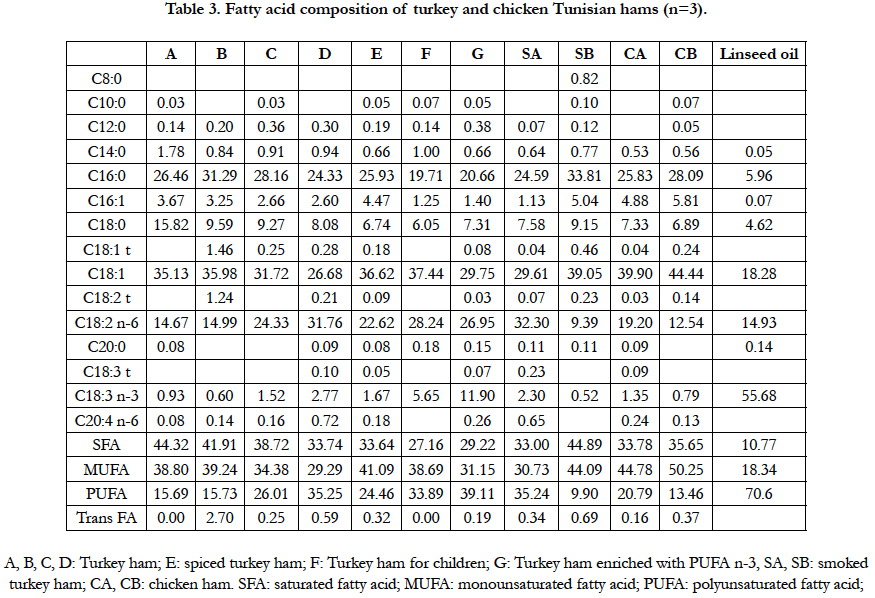
Table 3. Fatty acid composition of turkey and chicken Tunisian hams (n=3).
PUFA/SFA ratio, PUFA/MUFA ratio, and n-6/n-3 ratio were investigated to assess the nutritional properties of ham’s fat. In relation to PUFA/SFA, a value above 0.4 is recommended for healthy foods and diets [27]. The hams studied in the present work showed a PUFA/SFA ratio from 0.22 to 1.34, ham enriched with PUFA n-3 reaching the highest values. Such levels were higher than that found by others authors [1] in dry Spanish hams (0.19 to 0.30). Based on these criteria, the analysed hams were considered less “healthy” than dry Spanish hams.
The ratio PUFA/MUFA is around 0.7 indicating the high levels of MUFA in 80% of the tested samples. MUFA was represented by oleic acid in all hams kind.
Dietary fat intake should be ideally between 15% and 30% of total diet energy and will be classified as:
- SFA: less than 10%,
- PUFA: between 6% and 10% (n-6, 5-8%; n-3, 1-2%),
- MUFA: around 10 to 15% ,
- Trans fatty acids: less than 1% .
Hams enriched with n-3 PUFA (G) shown a high level of C18:3 n-3 (11.9%), six times more than the others hams (A, B, C, D). Such results were attributed to the linseed meals/oil during growth and/or preparation. Fatty acid composition of linseed oil was analysed and shown a high content of linolenic acid n-3 witch reach 55% (Table 3). It is suggested that such enrichment enhances the nutritional oil quality of some meat product for human health.
About 90% of the tested hams contained between 0 and 0.69 % trans fatty acids TFA and 10% more than 2.5% TFA. Trans 18:1 and C18:2 isomers were the major group of TFA present in all samples representing 25% to 100% of total trans isomers. The moderate content of TFA in the studied samples showed similarities to those reported by others authors [28] in poultry and products, mutton and beef products. Generally, trans fatty acids (18:1 trans) in raw muscle meat varies from as little as 22mg/100g in veal to 123mg in lamb, but is generally less than 3% of the total fatty acid content [29].
Trans-C18:1 level has frequently been considered to reflect total TFA contents of foods. However, recent studies are increasingly reporting the different groups of TFA (C18:1, C18:2 and C18:3). This trend is driven, firstly, by the greater detrimental health effects of the trans C18:2 and trans C18:3 as compared to the C18:1 group. Secondly, the isomeric composition and levels of trans fatty acids are indicative of their origin [30].
Some authors [31] define the ratio [C18:1-t/(C18:2-t + C18:3-t)] as indicative about the origin of trans FA. The ratio > 1 be a sign of partially hydrogenated oils while ratios <1 are indicative of refined deodorized edible oils. In our data, the ratio [C18:1-t/ (C18:2-t + C18:3-t)]) ranged between 0.13 and 2 indicating the non use of partially hydrogenated oil.
Table 4 shows the microbiological analysis of the most commercialized hams in Tunisia. 7 samples (5 turkeys and 2 poultries hams) among the 8 samples tested were in accordance with the standard and contained the rates of TMF ranging from 6.102cfu/g (PS) to 9.103cfu/g (B). Only the sample C (one sample of turkey ham) contains 5 104 cfu/g which is higher (5 104 > 104) and largely exceeded the limit value of fixed microbiological criteria of TMF which is equal to 104cfu/g. In our study, 87.5% of tested samples were in accordance with the standard legislation which authorizes us to conclude that the obtained result was satisfactory [32]. Indifferently of hams origins, results of total coliforms contain a count that is equal or less than the limit fixed by the International Organisation of Standardisation [18].
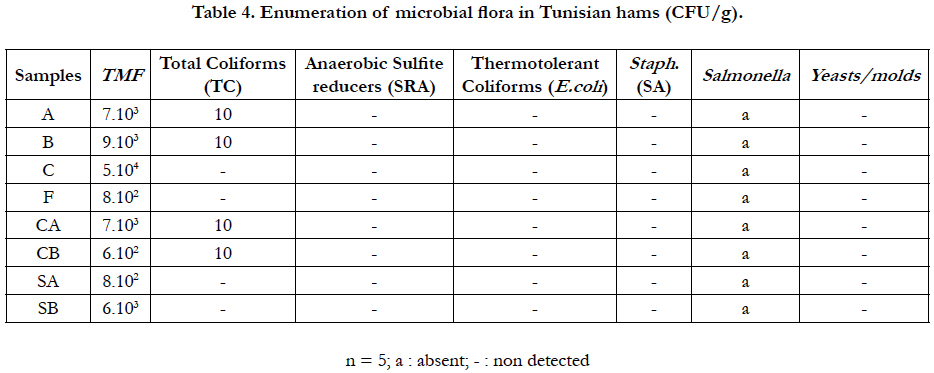
Table 4. Enumeration of microbial flora in Tunisian hams (CFU/g).
In our data, all tests are free of E. coli. According to the literature, the absence of E. coli indicates concretely the absence of faecal origin contamination from human or from animal. Microbiological analysis of 164 18°C food samples reported that the E. coli was detected in 7.9% with the largest population distribution in the range of 102 to < 103cfu/g [33].
According to the obtained results, no colony of sulfite-reducing anaerobes (SRA) was detected (Table 4). Others authors reported the presence of Clostridium perfringens in 16% of 51 RTE street-vended food products in Johannesburg South Africa [34]. Staphylococcal food poisoning is the fourth most common causative agent of food borne illness with meat and meat products as common food vehicles [35]. We noted that all tests are free of aureus (SA) and would not harm consumer’s health.
Epidemiological investigations into outbreaks related to several ready-to-eat products have demonstrated that the presence of Salmonella in the consumed products was frequently due to postprocess recontamination [36]. In our study we noted that all tests are free of Salmonella and would not harm consumer’s health (absence/25g) [20]. Results indicate also that no colony of yeasts/ molds was detected in the 8 studied samples and it was in accordance with the standard where the recommended values ranged between 104 to 105cfu/g.
In the study, the comparisons between samples revealed that the rates of TMF and of TC in smoked hams were less than the rates of TMF and of TC in unsmoked hams. This reduction of germs is closely related to the antibacterial effect of phenols and others compounds during smoking process. Similar effect obtained by smoking procedure on Listeria monocytogenes [37].
From the results obtained in the present work, it can be concluded that Tunisian hams could be considered as healthier from a nutritional point of view in relation to their high levels of unsaturated fatty acid (from 55% to 74%) and the slight amount of trans fatty acids (less than 0.7%), but, these products also contain a high amount of salt. The introduce of lows and policies for reducing the intake of saturated fat, trans FA and salt is required. The examination of TMF, TC, E. coli, SRA, SA, Salmonella spp and yeast and molds prove that for TMF 87.5 % of samples tested were satisfactory while for TC 75% of samples were unsatisfactory. However, all tested samples are free of pathogenic bacteria and of E. coli (faecal pollution) and of yeasts/molds investigated. We can announce that Tunisian hams are healthy, safe and therefore they are good to consume.
References
- Fernández M, Ordóñez JA, Cambero I, Santos C, Pin C, de la Hoz L. Fatty acid compositions of selected varieties of Spanish dry ham related to their nutritional implications. Food Chemistry. 2007 Jan 1; 101(1):107-12.
- Rhee KS. Fatty acids in meats and meat products. In ‘Fatty acids in foods and their health implications’. (Ed. CK Chow). 1992 ; 65–93.
- Albuquerque TA, Santos S, Silva MA, Beatriz M, Oliveira PP. An update on processed foods: Relationship between salt, saturated and trans fatty acids contents. Food Chem. 2018 Nov 30; 267:75-82. PMID: 29934192.
- Pérez-Farinós P, Saavedra MADR, Villalba CV, Robledo de Dios T. Transfatty acid content of food products in Spain in 2015. Gac Sanit. 2016 Sep- Oct; 30(5): 379-82. PMID: 27266514.
- Booker CS, Mann JI. Trans fatty acids and cardiovascular health: Translation of the evidence base. Nutr Metab Cardiovasc Dis. 2008; 18: 448-456. PMID: 18468872.
- Mozaffarian D, Aro A, Willett WC. Health effects of trans fatty acids: experimental and observational studies. Eur J Clin Nut. 2009; 63: S5-S21. PMID: 19424218.
- Teegala SM, Willett WC, Mozaffarian D. Consumption and health effects of trans fatty acids. J A O A C. 2009 Sep-Oct; 92(5): 1250-7. PMID: 19916363.
- WHO. Eliminating trans fats in Europe: A policy brief. Copenhagen: World Health Organization WHO, Regional Office for Europe. 2015; 13.
- Stender S, Dyerberg J, Astrup A. High levels of industrially produced trans fat in popular fast foods. N Engl J Med. 2006 Apr 13; 354(15):1650-2. PMID: 16611965.
- European Food Safety Authority (EFSA). The community summary report on trends and sources of zoonoses, zoonotic agents, antimicrobial resistance and foodborne outbreaks in the European Union in 2006. EFSA Journal. 2007 Dec; 5(12): 130r.
- Ganesan B, Brothersen C, McMahon DJ. Fortification of foods with omega-3 polyunsaturated fatty acids. Crit Rev Food Sci Nutr. 2014; 54(1): 98- 114. PMID: 24188235.
- Swiatkiewicz S, Arczewska-Wlosek A, Jozefiak D. The relationship between dietary fat sources and immune response in poultry and pigs: An updated review. Livestock Science. 2015 Oct 1;180:237-46.
- Lopez-Ferrer S, Baucells MD, Barroeta AC, Grashorn MA. n-3 enrichment of chicken meat. 1. Use of very long-chain fatty acids in chicken diets and their influence on meat quality: fish oil. Poultry Science. 2001 Jun 1; 80(6):741-52.
- AOAC (2016) Official method of analysis. In W. George & J. R. Latimer (Eds.), (Vol. 1, 20th ed.). Association of Official Analytical Chemists; Washington DC.
- International Organization for Standardization. Animal and vegetable fats and oils-Determination of the content of trans fatty acid isomers of vegetable fats and oils-Gas chromatographic method. ISO15304. 2002 (E)
- Animal IS, Fats V. Oils-Preparation of Methyl Esters of Fatty Acids. International Organization for Standardization, Geneva. ISO5509. 1978; 1-6.
- International Organization for Standardization. Microbiology of food and animal feeding stuffs–Horizontal method for the enumeration of microorganisms–Colony count technique at 30 degrees C. ISO 4833.2003.1-9.
- International Organization for Standardization. Microbiology of food and animal feeding stuffs-horizontal method for the enumeration of coliformscolony-count technique. ISO 4832. 2006.1-6.
- NF V08-060. Microbiology of food and animal feeding stuffs - Enumeration of thermotolerant coliforms by colony-count technique at 44 °C. Biokar diagnostics Violet Red Bile Agar (VRBA). 2009; 9.
- International Organization for Standardization. Microbiology of food and animal feeding stuffs. Horizontal method for the detection of Salmonella spp. ISO Norm 6579: 2002.2002.
- International Organization for Standardization. Microbiology of food and animal feeding stuffs–Horizontal method for the enumeration of sulfite-reducing bacteria growing under anaerobic conditions. ISO 15213: 2003; 1-6.
- NF V08-059. Microbiology of food - Enumeration of yeasts and molds by colony count at 25 ° C - Routine method. 2002.
- Amirkhanov K, Igenbayev A, Nurgazezova A, Okuskhanova E, Kassymov S, Muslimova M, et al. Comparative analysis of red and white turkey meat quality. Pak. J. Nutr. 2017; 16(6): 412-6.
- Oblakova M, Ribarski S, Oblakov N, Hristakieva P. Chemical composition and quality of turkey-broiler meat from crosses of layer light (ll) and meat heavy (mh) turkey. Trakia J. Sci. 2016 Jun 1; 2: 142-7.
- European Food Safety Authority (EFSA). The community summary report on trends and sources of zoonoses, zoonotic agents, antimicrobial resistance and foodborne outbreaks in the European Union in 2006. EFSA Journal. 2007 Dec; 5(12): 130r.
- Valenzuela Landaeta K, Atalah Samur E. Estrategias globales para reducir el consumo de sal. Archivos Latinoamericanos de Nutrición. 2011 Jun; 61(2): 111-9.
- Wood JD, Richardson RI, Nute GR, Fisher AV, Campo MM, Kasapidou E, et al. Effect of fatty acids on meat quality. Meat Sci. 2003; 66: 21-32. PMID: 22063928.
- Liu AD, Li JW, Liu ZP, Zhou PP, Mao WF, Li N, et al. Trans Fatty Acid Levels in Foods and Intakes among Population Aged 3 Years and above in Beijing and Guangzhou Cities, China. Biomed Environ Sci. 2015 Jul; 28(7): 477-85. PMID: 26248731.
- Droulez V, Williams PG, Levy G, Stobaus T, Sinclair A. Composition of Australian red meat 2002. 2. Fatty acid profile. Food Aust. 58: 335-341.
- Roe M, Pinchen H, Church S, Elahi S, Walker M, Farron-Wilson M, et al. Trans fatty acids in a range of UK processed foods. Food Chem. 2013; 140: 427-431. PMID: 23601386.
- Tyburczy C, Delmonte P, Fardin-Kia AR, Mossoba MM, Kramer JK, Rader JI. Profile of trans fatty acids (FAs) including trans polyunsaturated Fas in representative fast food samples. J Agric Food Chem. 2012 May 9; 60(18): 4567-77. PMID: 22509790.
- Richardson IR, Stevens AM. Microbiological examination of ready-to-eat stuffing from retail premises in the north-east of England. The ‘Get Stuffed’. survey. J Appl Microbiol. 2003; 94(4): 733-7. PMID: 12631209.
- Fang TJ, Wei QK, Liao CW, Hung MJ, Wang TH. Microbiological quality of 18 °C ready-to-eat food products sold in Taiwan. Int J Food Microbiol. 2003 Feb 15; 80(3): 241-50. PMID: 12423926.
- Mosupye FM, Von Holy A. Microbiological quality and safety of ready-toeat street-vended foods in Johannesburg, South Africa. J Food Protect. 1999 Nov; 62(11): 1278-84. PMID: 10571317.
- Kim HJ, Griffiths MW, Fazil AM, Lammerding AM. Probabilistic risk model for staphylococcal intoxication from pork-based food dishes prepared in food service establishments in Korea. J Food Protect. 2009 Sep; 72(9): 1897-908. PMID: 19777892.
- Reij MW, Den Aantrekker ED. Recontamination as a source of pathogens in processed foods. Int J Food Microbiol. 2004 Feb 15; 91(1): 1-11. PMID: 14967555.
- Hwang CA. The probability of growth of Listeria monocytogenes in cooked salmon and tryptic soy broth as affected by salt, smoke compound, and storage temperature. Food Microbiol. 2009 May; 26(3): 253-8. PMID: 19269565.