Crystallization of Amorphous Iron Nanoparticles by Means of Molecular Dynamics Simulation
Hoang HV
Faculty of General Science, Ho Chi Minh City University of Food Industry, Vietnam.
*Corresponding Author
Hue Hoang Van,
Faculty of General Science,
Ho Chi Minh City University of Food Industry,
Vietnam.
E-mail: huehv@cntp.edu.vn
Article Type: Research Article
Received: June 01, 2015; Accepted: July 18, 2015; Published: July 21, 2015
Citation: Hue HV (2015) Crystallization of Amorphous Iron Nanoparticles by Means of Molecular Dynamics Simulation. Int J Nano Stud Technol. 4(3), 88-92. doi: dx.doi.org/10.19070/2167-8685-1500017
Copyright: Hoang HV© 2015 This is an open-access article distributed under the terms of the Creative Commons Attribution License, which permits unrestricted use, distribution and reproduction in any medium, provided the original author and source are credited.
Abstract
Method of molecular dynamics (MD) simulation was applied to study the crystallization of the amorphous iron nanoparticles. The research sample is a sphere with a radius of 32.5Å under free boundary conditions. The mechanism of the crystallization occurred due to variation of structure and thermodynamic properties during the entire process. We've found that when the samples were heated to 900K and annealed through 3×10⁶ ÷ 107 MD steps, the crystalline nucleation is formed and grew up; and it leads to a shift from amorphous to crystalline to form bcc structure. Crystalline form consists of two parts: a core with crystalline structure and a surface with amorphous structure.
A detailed analysis reveals that the nucleation proceeds in a middle spherical layer. After that the crystal cluster grows firstly forward to the center of nanoparticle, and then it spreads to the surface. In the case when the sample is annealed at 300 K, we found small nuclei nearby the surface of nanoparticle. However, these nuclei cannot grow to a large size and the sample remains amorphous form for long annealing times.
2.Introduction
3.Calculation Procedure
4.Results and Discussion
5.Conclusion
6.Acknowledgement
7.References
Key Words
Nanoparticle; Crystallization; Molecular Dynamics; Amorphous Iron.
Introduction
Molecular dynamics simulation is an effective tool for gaining insight into the structure and dynamics of supercooled liquids and glasses, and it is also a very useful extension of experimental and analytical investigations in many fields of physics [1]. Especially, MD simulations have contributed to understanding of atomistic behavior of the solidification and melting of materials [2-6], since it is difficult to trace the motion of atoms directly by experiments. The crystalline mechanism of amorphous materials is also one of the problems studied by MD simulation. The crystallization proceeds when small crystalline regions are arised from the structural fluctuation in the amorphous solid. If the nuclei are larger than critical size, they will grow at the expense of noncrystalline part; otherwise they regress to the amorphous solid. Although there are intensive studies of crystal nucleation and growth [7-12], our knowledge about the dynamics and structure during these processes is still limited. Moreover, the correct description at atomistic level for the growth of crystalline phase in amorphous matrix is also unclear.
Recently, interest in nanoparticles has increased strongly in studying their unique properties [13-17]. For example, amorphous iron and iron-based nanoparticles exhibit specific magnetic, optical, sorption and other properties, and so this may leads to their advanced application in nanotechnology. Generally, amorphous state of nanoparticles is unstable and it can transform the crystalline state by using an appropriate annealing schedule.The stability of amorphous nanoparticles (ANP) against crystallization is of great interest, because this is related to their working ability in practice. The crystallization of ANP is studied mainly by experiments [18-24]. It was revealed that the glass and crystallization temperature of ANP is dependent on size. Also, the preparation conditions of ANPs influence on their transformation from amorphous to crystalline state. However, the crystalline mechanism of ANPs remains unclear. In particular, there is no information at atomistic level related to this problem. Therefore, this motivates the present study of the crystalline ANP by means of MD simulation.
Calculation Procedure
The MD simulation is conducted in a system containing 104 atoms Fe under free boundary conditions. The interactions between atoms are calculated with the Pak-Doyama potentials [5]. Initially, all atoms are randomly placed in a sphere with radii of 34 Å. Then the statistical relaxation is carried out until the system reaches the equilibrium. This sample is heated to temperature of 300 K. Then the sample is relaxed isothermally by 2.5×10⁷ steps to obtain a well-equilibrated sample which is called 300-sample. In order to study a crystalline process we have prepared the second sample (900-sample) by heating 300-sample to 900 K and then relaxing isothermally over 107 steps.
To determine a particular atom is in a locally crystalline or amorphous environment one can apply Honeycutt- Andersenthe technique [25]. Accordingly, the structure is analyzed by pairs of atoms via four indexes: (i) the first index indicates whether or not they are near-neighbors; We use a fix cutoff radius to determine the near-neighbors Rcutoff= 3.35 Å. (ii) the second index equals to the number of near-neighbors they have in common; (iii) the third index equals to the number of bonds among common near-neighbors; (iv) the fourth index is related to arrangement of bonds among common near-neighbors. The 1661 and 1441 pairs are the characteristic pairs for a bcc crystal. Because the Honeycutt - Andersen the technique consumes long computing time, we apply it only to check some configurations during annealing process. We use a following technique. Each atom in the bcc lattice is surrounding by 14 neighboring atoms. Among them six ones have 4 neighbors and eight others have 6 neighbors in common with the central atom. This criterion is used to determine whether a particular atom is in a locally crystalline or amorphous environment. We define a set of such atoms including a central atom and 14 neighbors as a basic nucleus. During the crystallization we detect all basic nuclei and then determine a crystal cluster. There are three types of atoms. The first one is the atom belonging to amorphous phase. The second type relates the atom that is in the boundary between amorphous and crystal phases. We call this type AC-atom. The third type (Cr-atom) is the atom in the locally crystalline environment. Obviously, the crystal cluster contains AC-atoms and Cr-atoms. The atoms belonging to the crystal cluster is called CC-atoms.
Results and Discussion
The pair radial distribution function (PRDF) of bulk sample is defined as: g(r) = n(r)/4πr2drρ0 (1)
where n(r) is the number of atoms in a spherical shell with thickness dr at a distance r from another atom; ρ0 is the number density of the sample. For the spherical nanoparticle the function gnano(r) is determined as follows: For each atom we find all atoms in a spherical shell with thickness dr at a distance r from the central atom, this spherical shell consists of two parts which are the inside and the outside of the nanoparticle (see Figure 1a).

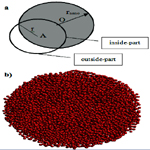
Figure 1. a) The schematic illustration of determining gnano(r) for nanoparticle; the central atom locates at point A and the nanoparticle centered at point O; the spherical shell consists of inside- and outside-parts. b)The snapshot of 300-sample implying the spherical shape.
The function gnano(r) is defined as: gnano(r) = <nnano (r)>/<Vin>ρ0nano (2)
where the bracket <> means the averaging over different atoms in the nanoparticle; ρ0nano is the number density of nanoparticle; Vin and Vout are the volume of inside - and outside - part, respectively; Vin+Vout = 4πr2dr. The snapshot of 300-sample plotted in Figure 1b indicates a spherical shape of constructed sample. Its radius is 32.5 Å, and the sample consists of two parts: the surface and core. If all particles of the surface are removed, then we obtain a corenanoparticle with radii of 28 Å. The PRDF of bulk sample is used to clarify the structure of the core of nanoparticle. The PRDF of bulk sample is shown in Figure 2 together with experimental data and gnano(r) of the core-nanoparticle. The result indicates the similarity between structures of core-nanoparticle and bulk sample.
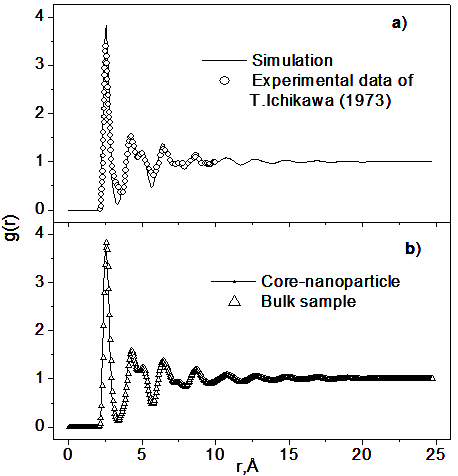
Figure 2. The comparison of PRDFs between bulk sample and experiment (a), and between bulk and core-nanoparticle sample (b). The sample was annealed at 300 K over 2.5×10⁷.
Figure 3 shows gnano(r) of 900-sample for different annealing time. For the short time the curve is similar to one of 300-sample samples. During this period the structure remains amorphous and no nucleation happens. For longer times, a number of new acute peaks appear showing distinct crystal characteristics. This evidences the structural transformation from amorphous to crystalline state. The phase change is related to the crystallization of material can be seen also from the evolution of the potential energy. As shown from Figure 4, the process can be divided into three periods. For the first period (n <3.8×10⁶) the energy exhibits a subtle change corresponding to the formation of small nuclei and slow growth of crystal phase. In the second period (3.8×10⁶ <n <5.8×10⁶) there is a sharp drop in the energy which indicates a rapid growth of the crystalline phase. In the third period the energy fluctuates and the crystal cluster grows to a maximal size.
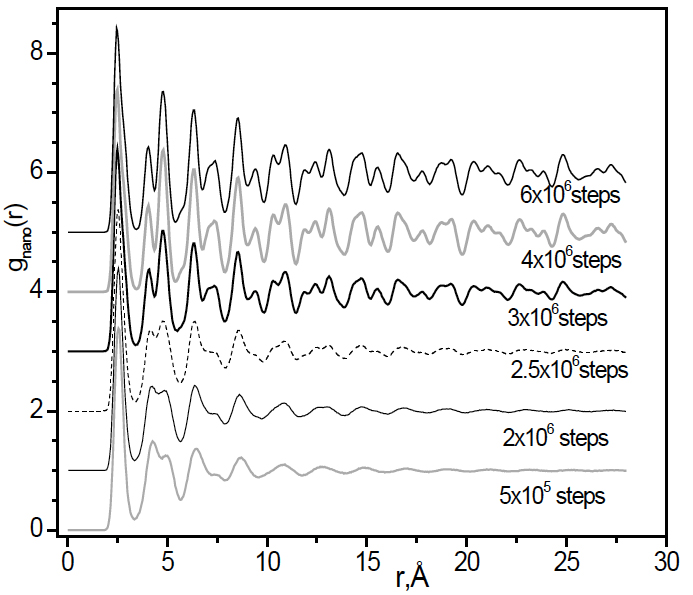
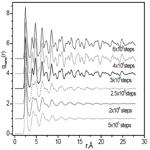
Figure 3. The evolution of gnano(r) for 900-sample during annealing process. The system was annealed over 107 steps and started to crystallize after 3×10⁶ steps.
The nucleation and growth of crystal phase can be observed directly by the size of crystal cluster which is defined by the number of CC-atoms, AC-atoms and Cr-atoms. In Figure 5 we show the number of these types of atoms during annealing process. It shows three periods like the ones presented in Figure 4. In the first period the crystal cluster grows slightly, meanwhile for the second period the number of different types of atoms varies strongly. This demonstrates that if the size of crystal cluster is bigger than some critical value, then the crystal cluster grows rapidly to a maximal size. The critical size can be determined by the point in Figure 5a where a rapid growth is observed. This size is found to be 250-300 atoms. In the third period the number of all types of atoms fluctuates. The crystal cluster grows to a maximal size. For more detailed visualization the result for the period from 5×10⁵ to 6×10⁵ steps is plotted in Figure 5b.
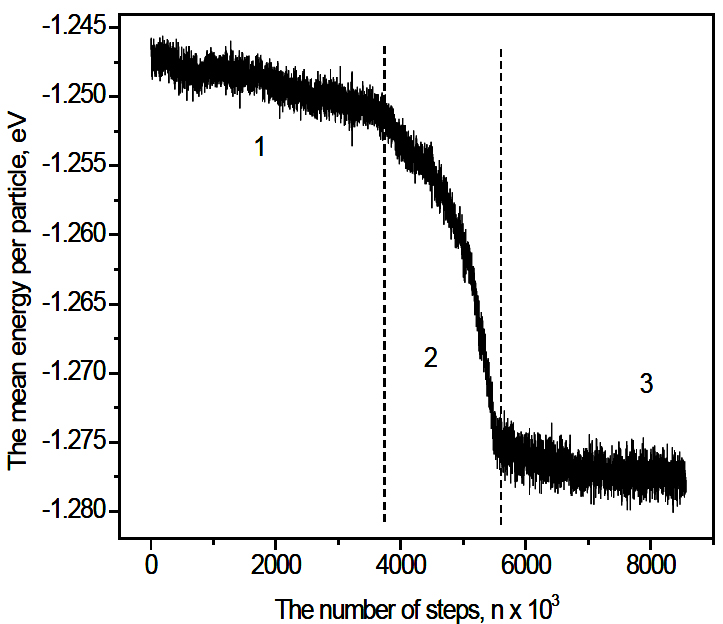
Figure 4. Time dependence of potential energy for 900-sample. Three periods are defined: 1) n < 3.8×10⁶; 2) 3.8×10⁶ < n < 5.8×10⁶; the energy drops sharply and the crystal cluster grows rapidly; 3) n > 5.8×10⁶; the energy fluctuates.
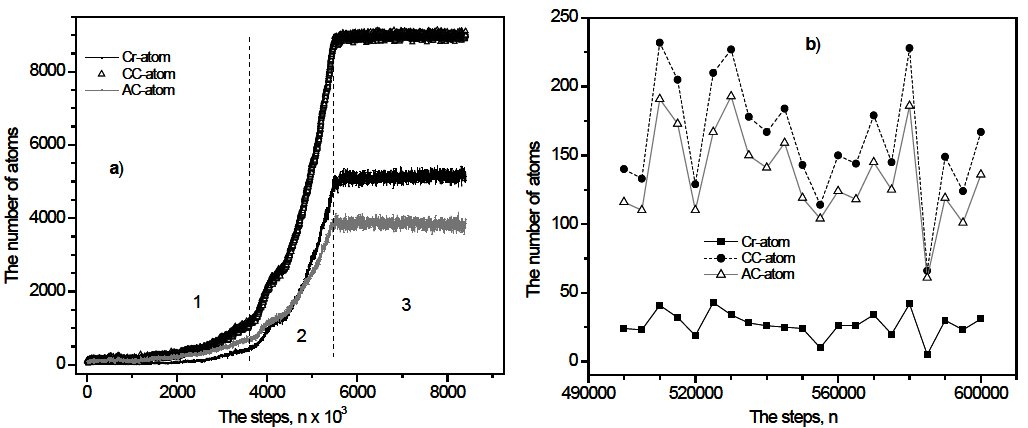
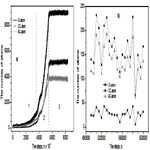
Figure 5. a) Time dependence of different types of atoms during 9×10⁶ steps ; Three periods are defined like ones in Figure 4; b) for the period from 5×10⁵ to 6×10⁵ steps.
One can see that the size of crystal cluster fluctuates from time to time. This implies that there are two opposite processes: the growth and the reduction of crystal cluster. The new basic nucleus may form inside the amorphous phase or in the boundary area between amorphous and crystal phases. During annealing process we determine the way by which the formation of new basic nucleus proceeds. The result shows that if the size of crystal cluster is bigger than 50 atoms, the formation of new basic nucleus is performed only by the second way.
To examine how the crystal cluster grows inside the amorphous matrix we divide the sample into five regions which are schematically illustrated in Figure 6a. Here the region 1 is a sphere with radius of 6.9 Å. Remaining region is a spherical layer with thickness of 6.9 Å.
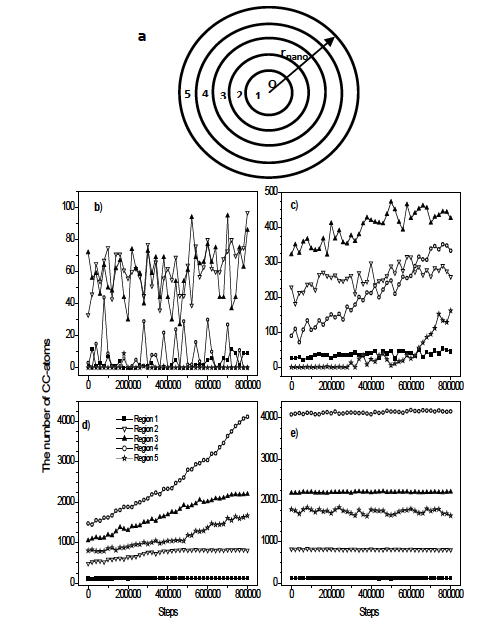
Figure 6. The five regions used to study the grouth of the crystal cluster (a); The evolution of a crystal cluster during 8×10⁵ steps at four moments of annealing process: n=0 (b); n=2×10⁶ (c); n= 4×10⁶ (d) and n= 6.5×10⁶ steps (e) ; the crystal cluster grows firstly forward to the center of nanoparticle, and then it spreads to the surface.
In Figure 6 we show the variation of different types of atoms during 8×10⁵ steps at four moments of annealing process. In first period (Figure 6b), a crystal cluster consisting about 100 atoms spreads in the area between regions 2 and 3. Although the growth and reduction of crystal phase proceeds intensively in regions 2, 3 and 4, but the crystal cluster tends to grow forward to the center of the sample. For the next period (Figure 6c), the growth of crystal phase occurs in all regions, but the fastest ones happen in the region 4 and 5. At the end of the third period (Figure 6d) all atoms in regions 1, 2 and 3 belong to the crystal cluster, i.e. the core of the sample fully crystallizes. In the fourth period (Figure 6e) the crystal cluster spreads over whole the region 4, and the number of CC-atoms in the region 5 fluctuates. It implies that when the crystallization is complete, the sample consists of a core with crystalline structure and a surface with amorphous structure.
The 300-sample is annealed for long time (about 2.5×10⁷ steps), however, the crystallization is not observed. Figure 7 shows the evolution of the crystal cluster for this sample. One can see that a crystal cluster consisting of several basic nuclei forms in the region 4, and sometime it grows up spreading to the region 3. However, the size of the nuclei (less than 50 atoms) is small and fluctuates. This implies that the thermal fluctuation at 300 K creates small nuclei, but they can not grow to a large size.
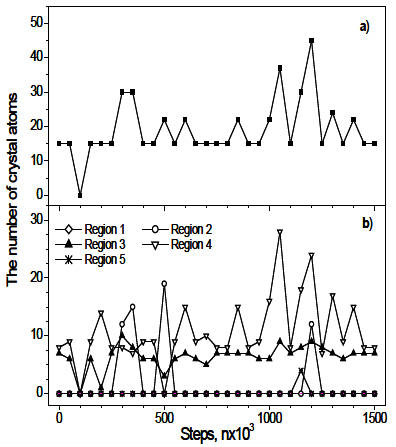
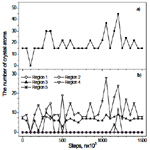
Figure 7. The evolution of the crystal cluster for 300-sample: a) in whole sample; b) in five regions implying the nucleation in the area nearby to the surface of the sample.
Conclusion
In this paper, the evolution of structural and thermodynamics properties of iron nanoparticle has been investigated by method of MD simulation. The nucleation and growth mechanism is studied by tracing crystal basic nuclei during annealing process. We found that the crystallization is observed when the sample is annealed for long times at 900 K. The phase of changing crystalline state is evidenced through the variation in PRDF and the mean potential energy. The result shows that the annealed sample transforms from amorphous to the bcc crystalline structure. The critical size of crystalline cluster is found to be 250-300 atoms. Final crystallized sample consists of two parts: a core with crystalline structure and a surface with amorphous structure. The nucleation doesn’t happen randomly in the sample, but intensively in a middle spherical layer. After that the crystal cluster grows firstly forward the center of the sample, and then spreads to the surface area. In this case when the sample is annealed at 300 K, a crystal cluster consisting of several basic nuclei has been detected in the area nearby to the surface of the sample. However, these nuclei cannot grow to a large size and the structure of nanoparticle remains amorphous.
Acknowledgement
The authors are grateful for support by the NAFOSTED Vietnam (grant No 103.01-2011.32) and technical support from the computing center of Hanoi Education University.
References
- Liggett TM (1985) Interacting Particle Systems. Springer, New York. 1-5.
- Hou ZY, Liu LX, Liu RS (2009) Simulation study on the evolution of thermodynamic, structural and dynamic properties during the crystallization process of liquid Na. Modelling Simul Mater Sci Eng 17(3): 035001.
- Shim JH, Lee SC, Lee BJ, Suh JY, Cho YW (2003) Molecular dynamics simulation of the crystallization of a liquid gold nanoparticle. J Crystal Growth 250(3): 558-564.
- Yanning Zhang, Li Wang, Weimin Wang (2007) Thermodynamic, dynamic and structural relaxation in supercooled liquid and glassy Ni below the critical temperature. J Phys: Condens Matter 19(19): 196106.
- Vo Van Hoang, Nguyen Hung Cuong (2009) Local icosahedral order and thermodynamics of simulated amorphous Fe. Physica B 404(2): 340-346.
- Xiaohua Li, Jinfan Huang (2003) Molecular dynamics studies of the kinetics of phase changes in clusters III: structures, properties, and crystal nucleation of iron nanoparticle Fe331. Journal of Solid State Chemistry 176(1):234-242.
- Chu JJ, Steeves CA (2011) Thermal expansion and recrystallization of amorphous Al and Ti: A molecular dynamics study. Journal of Non-Crystalline Solids 357(22): 3765-3773.
- Costa CBB, Maciel Filho R (2010) Nanoparticle processes modeling: the role of key parameters for population balances for on-line crystallization processes applications powder technology. Powder Technology 202(1): 89-94.
- Karaman M, Aydın M, Sedani SH, Ertuk K, Turan R (2013) Low temperature crystallization of amorphous silicon by gold nanoparticle. Microelectronic Engineering 108: 112-115.
- Jungblut S, Dellago C (2011) Crystallization of a binary Lennard-Jones mixture. J Chem Phys 134(10): 104501.
- Gasser U, Weeks ER, Schofield A, Pusey PN, Weitz DA (2001) Real-space imaging of nucleation and growth in colloidal crystallization. Science 292(5515): 258-262.
- Pedersen UR, Hudson TS, Harrowell P (2011) Crystallization of the Lewis- Wahnstrom ortho-terphenyl model. J Chem Phys 134(11): 114501.
- Shibuta Y, Watanabe Y, Suzuki T (2009) Growth and melting of nanoparticles in liquid iron: A molecular dynamics study. Chemical Physics Letters 475(4): 264-268.
- Levchenko EV, Evteev AV, Riley DP, Belova IV, Murch GE (2010) Molecular dynamics simulation of the alloying reaction in Al-coated Ni nanoparticle. Computational Materials Science 47(3): 712-720.
- Van Hoang V, Ganguli D (2012) Amorphous nanoparticles—Experiments and computer simulations. Physics Reports 518(3): 81-140.
- Carroll KJ, Pitts JA, Zhang K, Pradhan AK, Carpenter EE (2010) Nonclassical crystallization of amorphous iron nanoparticles by radio frequency methods. Journal of Applied Physics 107(9): 09A302.
- Si Qin, Weiwei Lei, Dan Liu, Peter Lamb,Ying Chen (2013) Synthesis of single-crystal nanoparticles of indium oxide by “urea glass” method and their electrochemical properties. Materials Letters 91: 5-8.
- Changsheng X, Junhui H, Run W, Hui X (1999) Structure transition comparison between the amorphous nanosize particles and coarse-grained polycrystalline of cobalt. NanoStructured Mater 11: 1061-1066.
- Alcoutlabi M, McKenna GB (2005) Effects of confinement on material behaviour at the nanometre size scale. J Phys: Condens Matter 17(15): R461.
- Gaoa L, Zhang Q (2001) Effects of amorphous contents and particle size on the photocatalytic properties of TiO2 nanoparticles. Scr Mater 44(8-9):1195-1198.
- Zhang H, Banfield JF (2002) Kinetics of Crystallization and Crystal Growth of Nanocrystalline Anatase in Nanometer-Sized Amorphous Titania. J Chem Mater 14: 4145-4154.
- Madras G, McCoy BJ (2007) Kinetic Model for Transformation from Nanosized Amorphous TiO2 to Anatase. Cryst Growth & Design 7(2): 250-253
- Pan C, Shen P, Chen SY (2007) Condensation, crystallization and coalescence of amorphous Al2 O3 nanoparticles. J Cryst Growth 299(2): 393-398.
- Epifani M, Pellicer E, Arbiol J, Sergent N, Pargnier T, et al. (2008) Capping ligand effects on the amorphous-to-crystalline transition of CdSe nanoparticles. Langmuir 24(19): 11182-11188.
- Honeycutt JD, Andersen HC (1987) Molecular dynamics study of melting and freezing of small Lennard-Jones clusters. J Phys Chem 91(19):4950–4963.