Carbohydrate Intake and Dietary Fiber Ratio as Diagnostic Tool for Diet Quality and Prognostics of Insulin Resistance in Brazilian Free-living Adults
Bernardino C1, McLellan KC2*, Corrente JE3, Burini RC1
1 Public Health Department, Botucatu Medical School, UNESP, Brazil.
2 Texas Institute for Kidney and Endocrine Disorders, Lufkin TX, USA; Food and Nutrition Dietetics, Human Science School, Stephen F Austin State
University, Nacogdoches TX, USA.
3 Biosciences Institute, Botucatu Medical School UNESP, Brazil.
*Corresponding Author
Katia Cristina Portero McLellan,
Texas Institute for Kidney and Endocrine Disorders,
Lufkin TX, USA; Food and Nutrition Dietetics, Human Science School,
Stephen F Austin State University, Nacogdoches TX, USA.
E-mail: kaportero@yahoo.com.br
Received: July 29, 2016; Accepted: August 22, 2016; Published: August 24, 2016
Citation: Bernardino C, McLellan KC, Corrente JE, Burini RC (2016) Carbohydrate Intake and Dietary Fiber ratio as Diagnostic Tool for Diet Quality and Prognostics of Insulin Resist ance in Brazilian Free-living Adults. Int J Food Sci Nutr Diet. 5(8), 319-324. DOI : dx.doi.org/10.19070/2326-3350-1600057
Copyright: McLellan KC© 2016. This is an open-access article distributed under the terms of the Creative Commons Attribution License, which permits unrestricted use, distribution and reproduction in any medium, provided the original author and source are credited.
Abstract
In major food-questionnaires the consumption of refined products (sugars and/or cereals) and whole grains are computed as total carbohydrate (CHO). Therefore, CHO to fiber ratio would be a correcting tool offering an indirect way to discriminate the actual risk of a high glycemic meal. This study aimed first to identify the CHO to fiber ratio in free-living adults and, secondly verify its relationship with the presence of either Metabolic Syndrome (MetS) and/or insulin resistance. Cross sectional study with 600 subjects (54.6 ± 11yrs) enrolled from an ongoing dynamic cohort study. Diet quality (Health Eating Index-HEI) and food intake were correlated with gender, age, anthropometry, plasma biochemistry, blood pressure and presence of MetS (ATP III-NCEP) and insulin resistance (HOMA-IR). Data on CHO to Fiber ratio were divided into quartiles. CHO to Fiber ratio showed a significant positive association with the daily servings of sugar and cereals, and a negative association with servings of legumes and HEI. When adjusted by age, gender, BMI and kcal/day, the lower quartile (Q1) of CHO to fiber ratio was discriminated by the fewer servings of sugar, higher servings of legumes and higher HEI score. Moreover, Q1 showed lower HOMA-IR than any other quartiles; however, without any significant relationship with the presence of MetS and neither with its components. Dietary CHO to fiber ratio associates strongly with insulin resistance (HOMA-IR) but weakly with altered glycemia. Thus, CHO to fiber ratio may be a useful, single, handful and costless dietary tool for diagnosing poor quality CHO-diets and insulin resistance risks.
2.Introduction
3.Methods
3.1.Sampling
3.2.Assessments
4.Results
5.Discussion
6.Acknowledgements
7.References
Keywords
CHO/Fiber Intake; Diet Quality; Insulin Resistance; Metabolic Syndrome.
Introduction
Western habits characterized by sedentary behavior accompanied imbalanced diet, are related to the development of metabolic disorders, such as abdominal obesity, metabolic syndrome (MetS), insulin resistance, and type 2 diabetes mellitus [1]. Poor eating habits, exemplified as a high carbohydrate intake, are closely related to the quantity and quality of carbohydrate consumption, reflected by glycemic response and insulin action [2-4].
Insulin resistance is a glucose homeostasis disorder directly influenced by refined sugar and carbohydrate (CHO) intake [5]. Yet, in the same category of CHO are the dietary fiber and its sources that represent a better CHO quality. As a strategy to assess this response, the glycemic index has been proposed, which consists on measurement of the relative impact of carbohydrate foods on plasma glucose concentrations [6, 7].
The American Diabetes Association (ADA) considers glycemic index as useful tool on dietary treatment, but this index is influenced by factors such as free-living conditions, food synergism, timing and amount of carbohydrate intake, which might lead to misinterpretations [8] .The European Association of Diabetes Study (EASD) recommends that the food source should be based on the carbohydrate quality, preferably with high fiber content providing lower glycemic index with beneficial impact on glycemic metabolism [9, 10]. Thereby, the CHO to Fiber ratio would provide an indirect index to assess the refined sugar consumption. This study aimed first to identify the CHO to fiber ratio in freeliving adults and, secondly verify its relationship with the presence of either Metabolic Syndrome (MetS) and/or insulin resistance (HOMA-IR).
Methods
In a cross-sectional study, data from 600 individuals (79.3% female), 54.6 ± 10.8 years old, participants of an ongoing dynamic cohort study “Move for Health” (Programa Mexa-se Pro-Saúde) were retrospectively collected (2007-2014). “Move for Health” is a program that promotes healthy lifestyle with nutrition counselling and supervised physical exercise as primary care for individuals with non-communicable chronic diseases and has been described elsewhere [11]. This study was conducted in accordance with the Declaration of Helsinki (1964). Subjects gave their written consent to participate in the study, which was approved by the Medical Ethics Committee of Sao Paulo State University – Medical School, Botucatu/SP.
Clinical assessments involved physical examination, clinical anamnesis, and blood pressure were performed. Blood pressure was measured with a digital sphygmomanometer (OMRON model HEM-413C) according to standard procedures [12]. Blood samples were collected by vacuum venous puncture, after a 10 to 12 hour fasting period, and centrifuged to obtain serum and plasma samples which were stored at -80°C until the end of the study. Serum glucose was assayed by dry-chemistry (Vitros System 5600®, Ortho Clinical Diagnostics, Johnson & Johnson Company, Raritan, NJ, USA). Laboratory analysis of total cholesterol, highdensity lipoprotein cholesterol (HDL-c) and triglycerides were performed within 4 hours after blood collection by dry chemistry method (Vitros® 5600, Ortho Clinical Diagnostics, Johnson & Johnson Company, Raritan, NJ, USA). Serum concentrations of insulin were quantified by a chemiluminescent method (Immulite 2000®, Siemens Healthcare Diagnostics, Marburg, Germany). Insulin resistance was estimated through homeostatic model assessment-insulin resistance (HOMA- IR) [13]. Body Mass Index (BMI) and waist circumference were evaluated according to the World Health Organization [15]. Body fat percentage (BF%) was assessed by a bioelectrical impedance device (Biodynamics®, model 450, USA). Metabolic Syndrome diagnosis followed the NCEP-ATPIII criteria [14].
Dietary intake data was assessed using a single 24-hour dietary recall. Dietary intake was documented by a certified dietitian; and to obtain precise information, the subjects were asked if that was a typical day of intake from them, how often they usually ate during the day, what variety of food was consumed, how the food was prepared, what the serving size was, and what the brand of the food/meal was. Total caloric intake was computed using the Brazilian food tables [16, 17]. The Healthy Eating Index (HEI) modified for the Brazilian population was used to assess the quality of the participants diet [18]. Eight food groups and 12 components to measure the variety and quality of food intake were evaluated. The daily amounts of ingested CHO and fibers were used for the CHO to fiber ratio calculation.
Statistical analyses were performed by SAS, version 9.2. The data were described as mean and standard deviation. CHO to fiber ratio was divided in quartiles: Q1 <9.75 (23.7 ± 10.8g/d fibers); Q2=9.75-13.05 (17.9 ± 8.2g/d fibers); Q3=13.05-18.97(13.1 ± 6.0g/d fibers) and Q4 >18.97(8.3 ± 3.8g/d fibers). ANOVA one way, Tukey`s post hoc and Linear multiple regression were applied to analyze the influence of co-variables on CHO to fiber distribution. Sample normality was tested by means of the Shapiro- Wilk test. For comparison of groups the ANOVA one way with repeated measure mode was used for normal distribution. For non-normal distribution the same model was fitted with a gamma distribution. The CHO to fiber ratio association with co-variables was done either unadjusted or adjusted for sex age, BMI and Total Energy Intake (TEI). The results were discussed based on the level of significance of p<0.05.
Results
The study population was predominantly women (79.3%), and overweight (83.7%). One fourth (24,5%) of individuals presented MetS. The most prevalent MetS component was waist circumference (71.2%) followed by hypertriglyceridemia (30.3%), and altered glycemia (13.3%). The male subjects presented significantly higher waist circumference, glycemia, triglyceridemia and lower levels of HDL-c than women (Table 1).
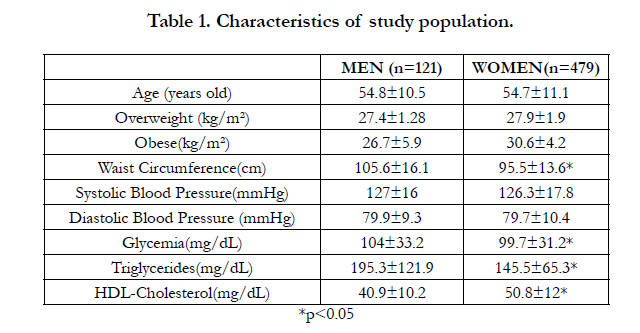

Table 1. Characteristics of study population.
The presence of MetS followed the values of CHO to fiber ratio with 48%, 58.3%, 33.3% and 64.3% from Q1 to Q4, however lacking of statistical significance. Similarly, there was no significant relationship of Q1 with the physical activity or VO2max and neither with the presence of metabolic syndrome or any of its components (Table 2).
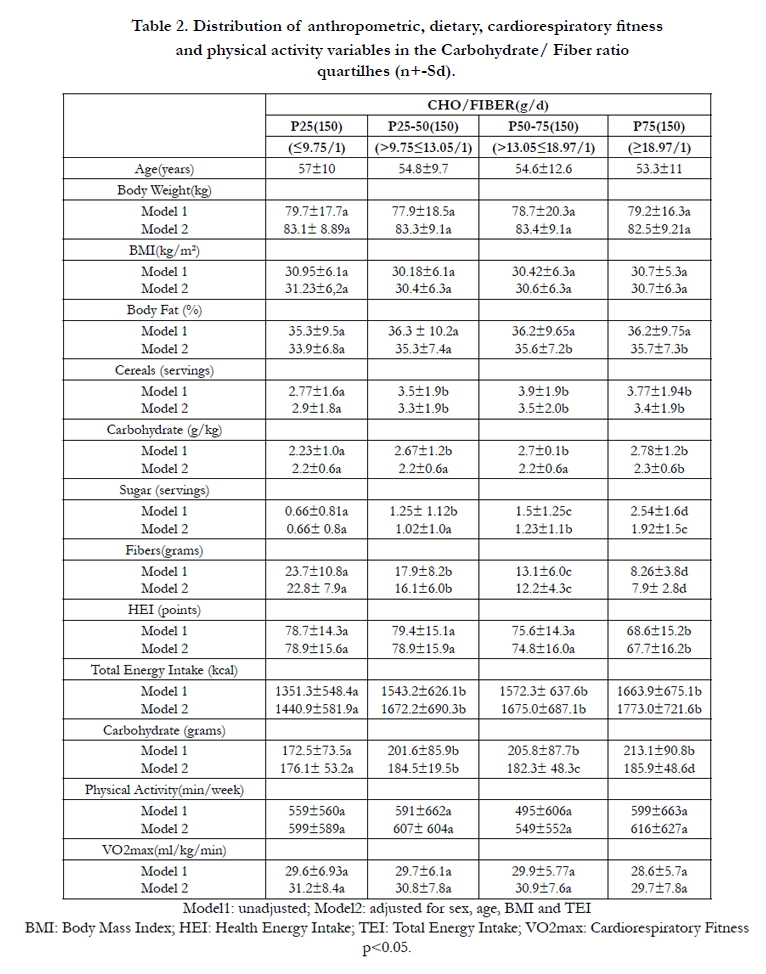
Table 2. Distribution of anthropometric, dietary, cardiorespiratory fitness and physical activity variables in the Carbohydrate/ Fiber ratio quartilhes (n+-Sd).
Individuals that consumed CHO to fiber ratio <10:1 (lowest quartile) had significantly lower values of % body fat, intake of sugar, carbohydrate (g and g/kg), total energy intake (kcal/day) and better quality diet (HEI), when compared with individuals in the highest quartile. As expected, individuals in the lower quartile of fiber intake had higher CHO to fiber ratio (Table 2), and lower values of HOMA-IR (Table 3). When adjusted by age, gender, BMI and TEI (kcal/day), Q1 was discriminated by the fewer servings of sugar, higher servings of legumes, and higher HEI score (Table 2). Additionally, the lower quartile of CHO to fiber ratio was significantly associated with lower HOMA-IR, even after adjustments (Table 3).
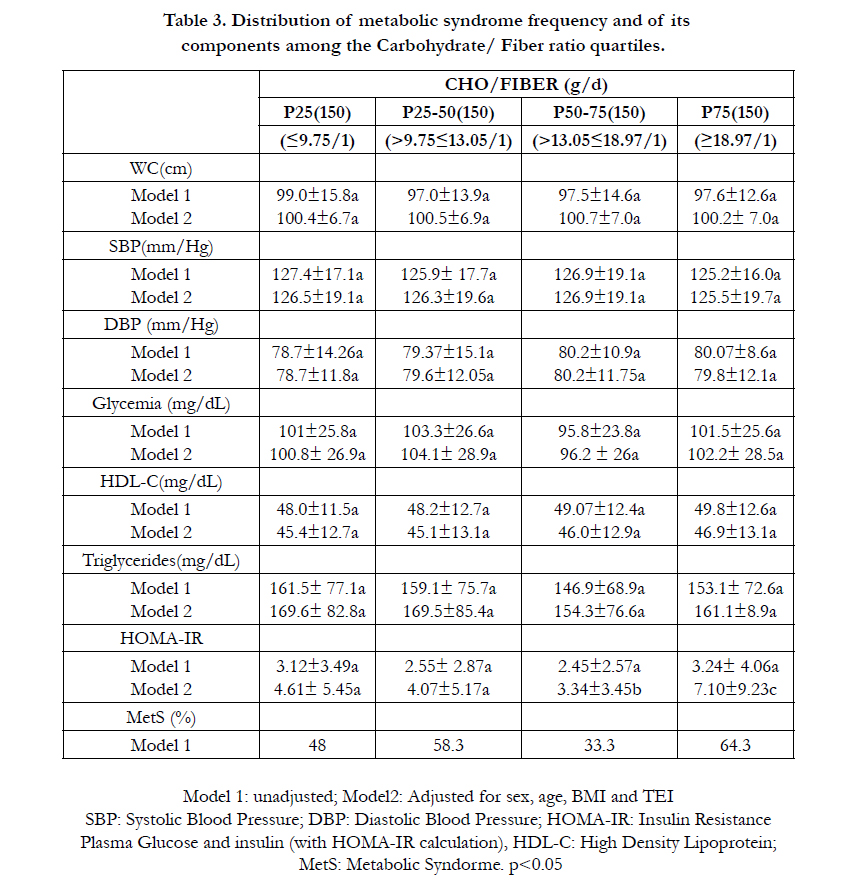
Table 3. Distribution metabolic syndrome frequency and of its components among the Carbohydrate/ Fiber ratio quartiles.
There was a positive correlation between CHO to fiber ratio with daily servings of cereals, sugar, and total energy intake. It was noted a negative correlation between CHO to fiber ratio with fiber intake, servings of legumes and HEI (Table 4). Multiple regression analysis indicated positive influence of daily servings of sugar and cereal, and negative influence of servings of legumes and HEI on the CHO to fiber ratio (Table 5).
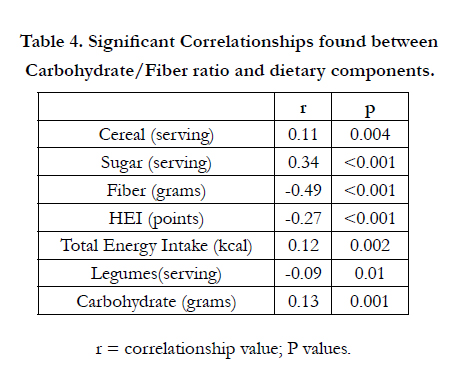
Table 4. Significant Correlationships found between Carbohydrate/Fiber ratio and dietary components.
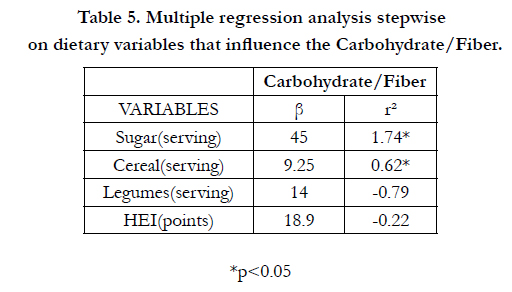
Table 5. Multiple regression analysis stepwise on dietary variables that influence the Carbohydrate/Fiber.
Discussion
As seen worldwide in lifestyle modification programs mostly of the spontaneously demanded participants were female, and considering physical exercises as keystone of that intervention protocol, the fitness status (which also means less aged) at baseline was probably mandatory. Moreover, 24.5% of the studied individuals presented MetS. Since the beginning of this century our data has showed MetS varying from 32.5%(< 40 yrs old) to 53.8%(>70 yrs), always with waist circumference as the most prevalent altered component [19].
Previous data from the same community showed a dietary behavior characterized by a low fiber intake, by means of all its sources. The dietary fiber intake was 7.2 ± 2.5 g/d in the lower quartile, 14.1 ± 2.0 g/d in the middle quartile, and 25.7 ± 8.8 g/d in the higher quartile without distinction between gender or age, neither among education, income, health self-perception and physical activity status. Interestingly, there were no differences of obesity and metabolic syndrome prevalence’s among the quartiles of dietary fiber intake. This fact would be attributed to their persistent monotonous diet, rich in calories but poor in quality and dietary fiber of all sources. The reason for that behavior surpassed age, gender, literacy and economic reasons, therefore might be cultural, what would make the solution even more difficult [20].
The best values of CHO to fiber ratio found in our study are described as related to better eating habits which consisted of increased vegetables and fiber consumption. The increased intake of fruits, vegetables, and whole grain contribute to higher fiber intake, leading to a lower overall caloric intake, greater weight loss and improved diet quality [21].
Moreover, the present study showed that individuals with lower CHO to fiber ratio presented lower values of HOMA-IR, % body fat, total energy intake, and therefore body composition compatible with individuals with optimum energy intake. Furthermore, higher fiber intake was associated with better insulin sensitivity markers.
It has been shown that HOMA-IR correlates inversely with consumption of fruits and dietary fiber. Also, it correlates with VO2 max and variables considered independent predictors of HOMAIR such as waist circumference, fat intake, MetS, low fiber intake, low muscle mass and high plasmatic concentrations of uric acid [22].
On the other hand, individuals who had higher values of CHO to fiber ratio (Q4) showed higher energy intake and higher percentage of fat. The total caloric intake was positively correlated with carbohydrate consumption, represented by increased of sugar and cereal intake. These food sources would probably present negative effects on satiety due of being rapidly digested and absorbed by gastrointestinal tract [12, 23, 24].
Higher values of HOMA-IR are positively associated with consumption of refined grains and low consumption of fruit [22]. Therefore, the control of glucose and insulin responses by a recommended pattern of food may be beneficial for the prevention and treatment of insulin resistance. However, besides strongly associated with dietary markers and insulin resistance (HOMA-IR), the CHO to fiber ratio seems to be a weak predictor of altered glycemia and MetS.
Insulin sensitivity and plasma glucose concentrations are influenced by factors such as free-living conditions of physical activity and aerobic fitness, as well as food synergism, timing and amount of carbohydrate intake. In the present data we could exclude any existing relationship of either physical activity or aerobic fitness (VO2max) with CHO to fiber ratio quartiles.
Thus,CHO to fiber ratio may be considered an additional dietary tool suitable for diagnosing poor quality CHO-diets associated with insulin resistance, but not with MetS and its components.
Acknowledgements
Supported partially by CAPES and CNPq.
References
- Gustat J, Srinivasan SR, Elkasabany A, Berenson GS (2002) Relation of selfrated measures of physical activity to multiple risk factors of insulin resistance syndrome in young adults: The Bogalusa Heart Study. Journal of clinical epidemiology. 55(10): 997-1006.
- Frost G, Leeds A, Trew G, Margara R, Dornhorst A (1998) Insulin sensitivity in women at risk of coronary heart disease and the effect of a low glycaemic diet. Metabolism, 47(10): 1245-1251.
- Oh K, Hu FB, Cho E, Rexrode KM, Stampfe, MJ, et al., (2005) Carbohydrate intake, glycaemic index, glycaemic load, and dietary fiber in relation to risk of stroke in women. American Journal of Epidemiology. 161(2): 161-169.
- Liu S, Willett WC, Stampfer MJ, Hu FB, Franz M, etc, (2000) A prospective study of dietary glycaemic load, carbohydrate intake, and risk of coronary heart disease in USwomen. Am J Clin Nutr, 71(6): 1455-61.
- Morris KL, Zemel MB (1999) Glycaemic index, cardiovascular disease, and obesity. Nutrition reviews. 57(9): 273-276.
- Foster-Powell K, Holt SH, Brand-Miller JC (2002) International table of glycaemic index and glycaemic load values: 2002. The American journal of clinical nutrition 76(1): 5-56.
- Pi-Sunyer FX (2002) Glycaemic index and disease. Am J Clin Nutr. 76(1): 290-298.
- Bantle JP, Wylie-Rosett J, Albright AL, Apovian CM, Clark NG, et al., (2008) Nutrition recommendations and interventions for diabetes: A position statement of the American Diabetes Association. Diabetes care. 31:S61-S78.
- Mann JI, De Leeuw I, Hermansen K, Karamanos B, Karlström B, et al., (2004) Diabetes and Nutrition Study Group (DNSG) of the European Association. Evidence-based nutritional approaches to the treatment and prevention of diabetes mellitus. Nutr Metab Cardiovasc Dis, 14(6): 373-394.
- Chandalia M, Garg A, Lutjohann D, von Bergmann K, Grundy SM, et al., (2000) Beneficial effects of high dietary fiber intake in patients with type 2 diabetes mellitus. New England Journal of Medicine, 342(19): 1392-1398.
- Portero-McLellan KC, Pimentel GD, Corrente JE, Burini RC (2010) Association of fat intake and socioeconomic status on anthropometric measurements of adults. Cad Saude Colet. 18(2): 266-74.
- Steemburgo T, Dall'Alba V, Almeida JC, Zelmanovitz T, Gross JL, et al., (2009) Intake of soluble fibers has a protective role for the presence of metabolic syndrome in patients with type 2 diabetes. European Journal of Clinical Nutrition. 63(1): 127-133.
- Levy JC, Matthews DR, Hermans MP (1998) Correct homeostasis model assessment (HOMA) evaluation uses the computer program. Diabetes care,21(12): 2191-2192.
- Expert Panel on Detection E (2001) Executive summary of the Third Report of the National Cholesterol Education Program (NCEP) expert panel on detection, evaluation, and treatment of high blood cholesterol in adults (Adult Treatment Panel III). Jama, 285(19): 2486-2497.
- World Health Organization (2000) Obesity: preventing and managing the global epidemic (No. 894). World Health Organization.
- Federal University of São Paulo (UNIFESP) (2002) Support program for nutrition. Sao Paulo, Brazil.
- Philippi ST (2002) Tabela de composiçäo de alimentos: suporte para decisäo nutricional. In Tabela de composiçäo de alimentos: suporte para decisäo nutricional. Coronário. 2002. 2a.ed.
- Mota JF, Rinaldi AEM, Pereira AF, Maestá N, Scarpin MM, et al., (2008) Adaptação do índice de alimentação saudável ao guia alimentar da população brasileira. Revista de Nutrição. 545-552.
- Burini RC, Carandina L, Barros MBDA (2013) Behavioral risk factors and effects of lifestyle modification on adults with diabetes: A Brazilian community- based study. Emerging Issues in Medical Diagnosis and Treatment.1-20.
- Mclellan KCP, Ramos FMM, Corrente JE, Sloan LA, Burini RC (2015) Evolutionary roles of dietary fiber in succeeding metabolic syndrome (MetS) and its responses to a lifestyle modification program: A Brazilian Communitybased study. (1st edn), Nova York: New Science Publishers. 2015: 1-7.
- Schulze MB, Liu S, Rimm EB, Manson JE, Willett WC, etal., (2004) Glycaemic index, glycaemic load, and dietary fiber intake and incidence of type 2 diabetes in younger and middle-aged women. The American journal of clinical nutrition, 80(2): 348-356.
- Mota JF, Moreto F, Medina WL, Pereira ECL, Burini RC (2011) Nutritional and metabolic risk factors for insulin resistance in adults. International Journal of Nutrition and Metabolism. 3(7): 90-96.
- Jiménez-Cruz A, Turnbull WH, Bacardi-Gascón M, Rosales–Garay P (2004) A high-fiber, moderate-glycaemic-index, Mexican style diet improves dyslipidemia in individuals with type 2 diabetes. Nutrition research, 24(1): 19-27.
- Ludwig DS (2000) Dietary glycaemic index and obesity. The Journal of nutrition, 130(2): 280S-283S.